
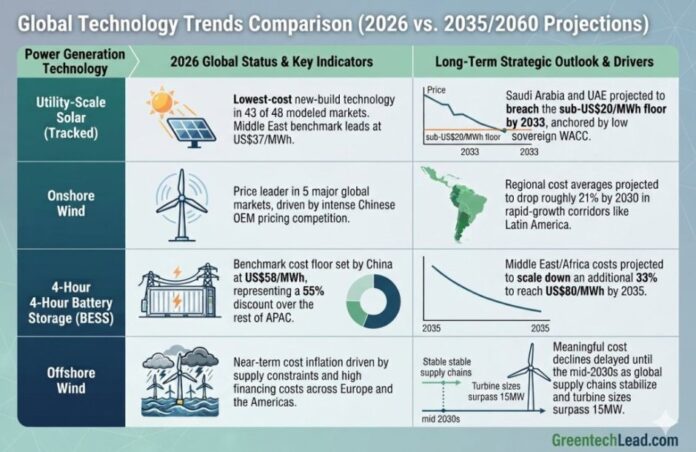
Four-hour battery storage is now cheaper than open-cycle gas turbines in all 43 markets where both technologies were modelled, according to Wood Mackenzie’s latest global levelized cost of electricity (LCOE) assessment.
The findings show two cost shifts shaping power investment in 2026. Single-axis tracker solar is the lowest-cost new-build generation technology in 43 of 48 markets, while onshore wind leads in the remaining five. Battery manufacturing expansion is also lowering storage costs as gas turbine shortages and fuel volatility increase peaking generation expenses, according to Wood Mackenzie’s report.
Middle East and Africa Solar Costs to Fall to $24/MWh by 2035
The Middle East and Africa has some of the world’s most competitive renewable energy costs. Single-axis tracker solar averages $37 per megawatt-hour (MWh) in 2026, with Wood Mackenzie forecasting a decline to $24/MWh by 2035.
Saudi Arabia and the UAE are expected to achieve solar LCOE below $20/MWh by 2033, strengthening their position among the lowest-cost solar markets.
Battery storage is becoming increasingly competitive alongside this inexpensive generation. Four-hour storage costs $120/MWh in 2026 and is forecast to fall 33 percent to $80/MWh by 2035. Wood Mackenzie finds that storage already undercuts open-cycle gas turbines on cost in every gas market modelled across the region.
Onshore wind is also benefiting from more competitive Chinese turbines. Egypt and Morocco achieve particularly low costs, supported by capacity factors of 40–45 percent.
These trends improve the economics of combining renewable generation with storage for evening demand and other short-duration balancing needs.
China Sets Battery Storage Cost Benchmark in Asia Pacific
China remains the global benchmark for grid-scale battery storage costs, with LCOE more than 55 percent below the $134/MWh average for the rest of Asia Pacific.
Its advantage reflects integrated domestic supply chains and manufacturing scale. Competitive Chinese supply is expected to lower the average for Asia Pacific excluding China to $92/MWh by 2036.
Japan, Australia and the Philippines are expected to retain higher costs because of import duties, installation expenses and domestic manufacturing policies.
Solar remains Asia Pacific’s most cost-competitive power source, but differences between markets are substantial. In 2026, solar generation in the highest-cost market is more than 200 percent more expensive than in the lowest-cost market. That gap is forecast to widen to 250 percent by 2030, even as costs improve in every market.
Onshore wind costs vary by more than six times between the cheapest and most expensive markets. Chinese turbine manufacturers and higher-capacity models are expected to improve wind’s competitiveness against coal across South and Southeast Asia.
For offshore wind outside China, meaningful cost reductions are expected from the early 2030s as supply chains mature and larger turbines enter deployment.
Latin America Wind LCOE to Reach $58/MWh by 2030
Single-axis tracker solar remains Latin America’s lowest-cost generation technology in 2026. Average solar costs are forecast to decline 38 percent by 2060.
Brazil, Chile and Mexico retain structural advantages because strong solar resources and high capacity factors increase electricity output from installed capacity.
Onshore wind is forecast to deliver a faster near-term reduction. Regional average LCOE is expected to fall nearly 21 percent, from $73/MWh to $58/MWh by 2030. Expanding Chinese turbine supply increases pricing competition, while larger turbines improve energy yields.
Grid-scale storage is growing through renewable project storage requirements and standalone procurement for grid stability. Storage LCOE is forecast to decline 42 percent by 2060 as deployment expands and regulatory frameworks develop.
Offshore wind has a longer path to competitiveness. Regional average LCOE is expected to approach combined-cycle gas turbine parity, before firming costs, only in the early 2040s. Development in Brazil and Colombia is beginning to support local supply chains.
Europe Faces Higher Solar and Battery Capital Costs in 2026
Solar remains Europe’s cheapest power technology despite near-term capital cost increases.
Wood Mackenzie forecasts a 14 percent increase in solar capital expenditure in 2026, driven by higher module costs. Over the longer term, fixed-tilt solar LCOE is expected to decline 22 percent by 2060.
Onshore wind capital costs are forecast to decrease at an average annual rate of 2.5 percent through the remainder of the decade. After 2030, rising capacity factors become the main driver of lower LCOE, with costs reaching $60/MWh by 2060.
Battery storage turnkey capital expenditure rose about 2 percent, its first increase in three years. Battery cell prices rebounded approximately 10 percent from their 2025 low, reflecting stronger demand and higher lithium prices.
Storage capital costs are nevertheless forecast to fall 12 percent by 2031. The pace subsequently moderates as lithium prices are projected to roughly double in 2029, when oversupply clears.
Europe also has the highest fossil-fuel generation costs among the modelled regions. Levelized carbon costs are projected to exceed fuel costs by 2030, adding pressure to thermal generation economics.
North America Solar Prices Rise as Tariffs Affect Supply
North America faces a more difficult near-term cost environment because of tariffs, trade measures and supply chain restrictions.
Utility-scale solar receives some protection from 168 GW of safe-harboured capacity, but module prices are still forecast to rise approximately 5 percent annually through 2030.
Residential and commercial projects face greater exposure. Module prices for these segments are forecast to increase 6 percent in 2027, followed by a further 14 percent in 2028.
Long-term improvements in onshore wind capital and operating costs are expected to reduce LCOE 16 percent by 2060.
Storage tax credits help offset supply chain constraints and foreign entity of concern restrictions. Wood Mackenzie anticipates a cost increase following investment tax credit phase-out from 2038, although new battery chemistries, hardware commoditisation and domestic manufacturing are expected to reduce storage LCOE 10 percent by 2060.
Meanwhile, data centre electricity demand is contributing to a gas generation equipment supply deficit extending through the late 2030s, keeping thermal capital costs elevated.
What the LCOE Findings Mean for Power Planning
The assessment strengthens the cost case for solar, wind and four-hour battery storage. However, generation cost rankings do not establish round-the-clock supply capability.
Batteries store electricity produced elsewhere, and four-hour systems provide a defined discharge duration. A lower modelled cost than gas peaking therefore does not demonstrate that batteries can meet every reliability requirement or cover extended renewable generation shortfalls.
Project decisions must also consider charging costs, grid access, utilisation, financing and the hours when electricity is needed. Wood Mackenzie’s findings provide a technology cost benchmark; developers and utilities must assess how each asset performs within the wider power system.
BABURAJAN KIZHAKEDATH
