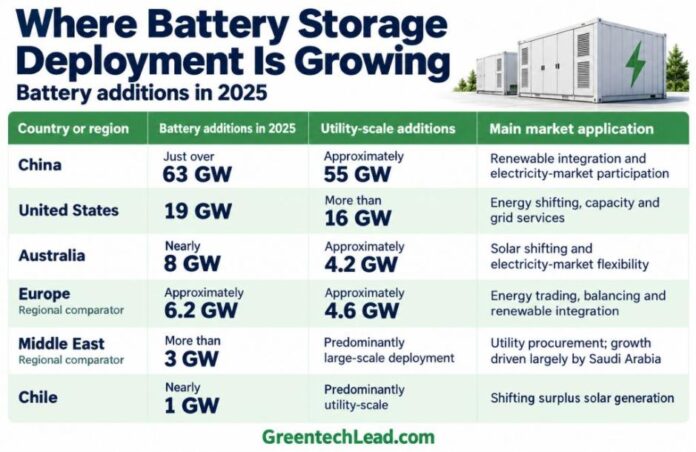
China and the United States lead global battery storage deployment, while Australia, Saudi Arabia, India and Chile are expanding storage to meet different electricity-system needs. Their markets range from utility procurement and renewable-energy integration to wholesale trading and corporate electricity supply.
Global battery storage additions reached 108 GW in 2025, up approximately 40 percent from 2024. Utility-scale systems accounted for around 87 GW, according to the International Energy Agency’s 2026 analysis.
Annual additions provide a useful measure of deployment momentum. Operating capacity, energy capacity in GWh, and contracted projects answer different questions. The comparison below uses 2025 additions, followed by selected project and policy developments reported through 2026.
These are selected markets, rather than a complete country ranking. European and Middle Eastern totals are explicitly identified as regional figures. India’s 2026 developments appear separately because programme targets should not be compared with annual commissioned additions.
China: Deployment Scale and Manufacturing Capacity
China combines the largest annual deployment volume with a domestic supply chain spanning cells, battery packs, power-conversion equipment and system integration.
CATL, BYD and Sungrow participate at different points in that chain. Manufacturing shipments, however, should remain separate from batteries installed within China: equipment can be exported, stored or incorporated into projects commissioned later.
The same distinction applies to Chinese “new-type energy storage” statistics, which can cover technologies beyond batteries. Using battery-only additions for the international comparison avoids mixing different technology definitions.
United States: Utility Contracts and Market Revenues
US utility-scale operating battery capacity reached nearly 52 GW by June 2026, following 8.3 GW of additions during the first half. This cumulative figure is separate from the country’s 2025 annual additions.
California projects frequently support evening demand and utility reliability requirements. Texas batteries also participate in wholesale energy and ancillary-service markets. Neither market has a single revenue model: contract coverage and permitted market participation differ between assets.
Arevon’s 300 MW/1,200 MWh Nighthawk facility, operational since August 2026, provides a specific example of utility-linked storage. Arevon owns and operates the four-hour battery under a long-term PG&E agreement.
Australia: Eraring Expands the Storage Fleet
Australia’s rooftop solar generation creates opportunities to store electricity during periods of abundant supply and discharge it later. Battery economics nevertheless depend on price spreads, operating constraints and competition from other flexible resources.
Origin Energy’s Eraring battery development illustrates the scale of investment at existing power-generation sites.
Eraring Battery 1 is operating at 460 MW/1,770 MWh. Origin lists the combined Battery 1 and Battery 2 development at 700 MW/3,160 MWh when complete.
The combined configuration represents approximately 4.5 hours of nominal storage. It should remain separate from the capacity already operating, and supersedes the earlier 700 MW/2,800 MWh expansion figure.
Saudi Arabia: Three Projects Contracted for 6 GWh
Saudi Arabia is expanding storage through central procurement and long-term service agreements.
ACWA Power signed three Saudi battery storage agreements with the Saudi Power Procurement Company in August 2026 for Haden, Muwayh and AlKahfah.
Each facility is rated at 500 MW/2,000 MWh, creating a combined 1.5 GW/6 GWh portfolio. Each has a 15-year agreement.
These are four-hour storage developments with a named utility customer. The signing announcement establishes contracted capacity, rather than confirming commercial operation. Their future commissioning should therefore be tracked separately from Saudi Arabia’s existing installations.
India: Operating Projects and Transmission-Linked Expansion
India’s latest operating installations include Adani Green Energy’s 6.63 GWh Khavda BESS. AGEL announced that capacity in October 2026, up from 3.55 GWh in June. The company described Khavda as the world’s largest operational battery installation at a single location.
Alongside operating projects, India is planning storage within a broader transmission programme.
The government approved Green Energy Corridor Phase III in September 2026, with a total outlay of ₹1,86,405 crore. This includes ₹1,36,378 crore for intra-state transmission and ₹50,000 crore for 50 GWh of BESS.
The programme targets completion by FY2032-33 and supports evacuation of up to 135 GW of renewable energy. The 50 GWh represents planned programme capacity; it is neither commissioned storage nor an addition to the current operating total.
Europe and Chile: Different Grid Requirements
Europe’s market is shifting toward larger utility-scale batteries. Country-level comparisons should distinguish Germany, the UK and Italy rather than treating the region as a single national market.
Chile’s storage developments are closely associated with abundant solar generation and the need to deliver electricity beyond daytime production hours. For both markets, project-level evidence on curtailment, customer agreements and grid access is more useful than assuming every battery captures the same economic benefit.
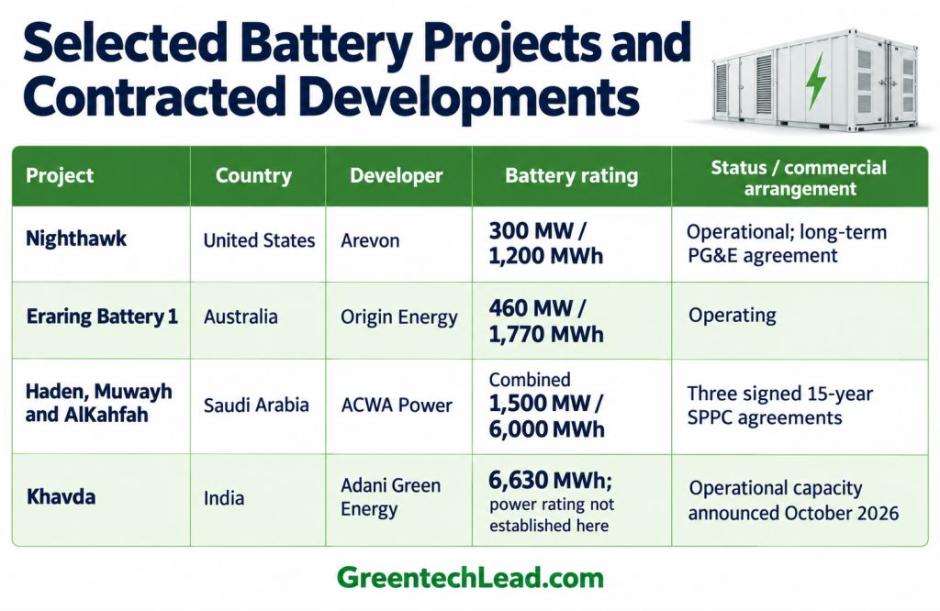
The table compares selected examples, not the largest projects in every country.
Costs and Duration Need Comparable Definitions
A 1 GW/1 GWh battery has one hour of nominal duration; a 1 GW/4 GWh system has four hours. Actual delivery depends on charge level, losses and operating limits.
Ember’s December 2025 battery storage cost analysis estimated approximately $125/kWh for utility-scale systems lasting four hours or more outside China and the US: around $75/kWh for equipment and $50/kWh for installation and connection.
At that benchmark, 1 GWh would imply approximately $125 million. This is an illustrative calculation, not a budget for any project listed above. Local connection costs, procurement terms and financing can materially change expenditure.
What Will Determine the Next Deployment Wave?
The next comparisons should track commissioned GW and GWh, customer commitments and operating dates. Announced pipelines and government programmes show development intentions; they do not establish delivered grid capacity.
China and the US provide scale benchmarks. Australia demonstrates deployment alongside high solar penetration, Saudi Arabia offers long-term utility procurement, and India is linking storage expansion with transmission investment. Their progress will become measurable as contracted and planned capacity enters commercial operation.
SHAFANA FAZAL