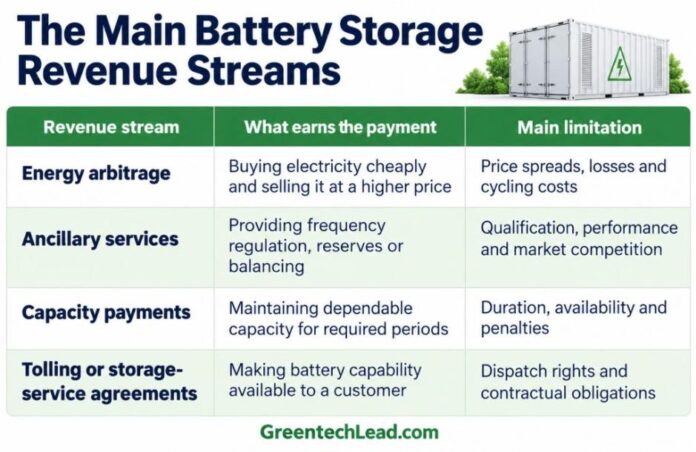
Battery energy storage projects earn money by selling electricity at prices above their charging costs and receiving payments for capacity, balancing or contracted storage services. Their profitability depends on how much revenue remains after electricity purchases, operating expenses, battery degradation and financing.
A battery can generate substantial electricity sales while delivering modest investor returns. Charging costs, limited trading opportunities, contract restrictions and future augmentation expenditure can absorb much of its income.
Understanding BESS economics therefore requires a clear distinction between gross revenue, operating margin and cash available to investors.
Renewable-energy shifting is an application that can support these arrangements. Its value may be captured through electricity trading, a renewable PPA or a storage-service contract. It should not automatically be added as another independent revenue stream.
The IEA’s battery storage analysis reports that energy shifting became the dominant application for new projects in 2025. Batteries can still provide balancing services alongside that primary role, subject to operating constraints.
Energy Arbitrage: Charging Costs Determine the Margin
Consider a hypothetical 100 MW/400 MWh battery with four hours of usable discharge capacity.
Assume it purchases electricity at $30/MWh, sells at $100/MWh, and operates at 90 percent round-trip efficiency, measured consistently between charging input and delivered output.
To deliver 400 MWh, it needs approximately 444.44 MWh of charging electricity.
| Per-cycle calculation | Amount |
| Electricity sales: 400 MWh × $100 | $40,000 |
| Charging cost: 444.44 MWh × $30 | $13,333 |
| Arbitrage margin before other costs | $26,667 |
Ignoring losses would overstate this margin. Trading fees, maintenance and the economic cost of cycling must also be considered.
At 300 equivalent full cycles annually, the example produces $12 million in electricity sales, approximately $4 million in charging costs, and $8 million in arbitrage margin.
These are hypothetical achieved prices across modeled transactions, not a forecast for a particular market.
A Worked 100 MW/400 MWh Cash-Flow Example
Assume initial CAPEX of $50 million. This corresponds to $125/kWh, using the scope of Ember’s utility-scale battery cost analysis.
Published in December 2025 and reflecting October 2025 evidence, that benchmark concerns large systems lasting four hours or more outside China and the United States. Applying it here illustrates the arithmetic; it is not a project quotation.
Assume the project also earns $1 million annually from compatible service commitments, after accounting for dispatch restrictions.
| Annual base-case calculation | Amount |
| Electricity sales | $12.00 million |
| Additional service income | $1.00 million |
| Total gross revenue | $13.00 million |
| Charging electricity | −$4.00 million |
| Other cash operating expenses | −$2.00 million |
| Operating cash flow before financing and taxes | $7.00 million |
| Illustrative augmentation reserve contribution | −$1.00 million |
| Cash after reserve contribution | $6.00 million |
The $2 million operating allowance covers assumed maintenance, insurance, software, trading fees and other expenses. It excludes augmentation, avoiding double-counting.
The reserve contribution sets aside cash for future battery work. It is not necessarily augmentation expenditure incurred that year. A detailed investment model should record actual expenditure when it occurs and track reserve balances separately.
Price Spreads Can Change the Result Sharply
The following scenarios hold initial CAPEX, efficiency, operating expenses and reserve contributions constant. They change achieved electricity prices, cycling and additional service income.
| Assumption or result | Downside | Base | Upside |
| Equivalent full cycles annually | 250 | 300 | 320 |
| Charging price | $40/MWh | $30/MWh | $25/MWh |
| Selling price | $80/MWh | $100/MWh | $110/MWh |
| Annual arbitrage margin | $3.56m | $8.00m | $10.52m |
| Additional service income | $0.50m | $1.00m | $1.50m |
| Operating expenses, excluding charging | $2.00m | $2.00m | $2.00m |
| Reserve contribution | $1.00m | $1.00m | $1.00m |
| Cash after reserve, before financing and taxes | $1.06m | $6.00m | $9.02m |
| CAPEX divided by annual cash | 47.4 years | 8.3 years | 5.5 years |
These ratios assume unchanged annual cash generation. They are not project IRRs or equity payback forecasts.
The downside ratio indicates weak recovery economics under those assumptions; it does not imply the battery could operate for 47 years. Degradation, augmentation, financing and changing revenues require a year-by-year model.
Real Contracts Show Who Pays for Storage
California’s 350 MW/1,400 MWh Crimson facility demonstrates two commercial structures within one project.
Southern California Edison contracted 200 MW/800 MWh under a full tolling agreement. PG&E contracted 150 MW/600 MWh for resource adequacy, with that capacity able to participate in California’s wholesale market.
The disclosed Crimson storage contracts show why capacity payments and electricity-market income must be modeled according to the rights allocated by each agreement.
India’s 180 MW/360 MWh IndiGrid Gujarat project provides a financing example. The IFC project disclosure lists expected project cost of $76 million and financing of up to $55 million.
Those figures illustrate the distinction between project cost and financing; they do not disclose realized investment returns.
Revenue Stacking Requires Dispatch Discipline
A battery cannot commit the same available capability to incompatible services. Reserving power or maintaining charge for a contractual obligation can reduce energy available for arbitrage.
An operating model must respect power limits, usable energy, charge level, efficiency, availability and contractual requirements. It should also consider whether an additional cycle earns enough margin to compensate for its effect on battery life.
Merchant revenues can change as competitors enter the market. More batteries may narrow electricity-price spreads or increase competition for balancing payments. Contracts can improve revenue visibility, but performance penalties and counterparty obligations remain relevant.
Measure Returns Over the Asset’s Life
Simple payback gives a rough indication of capital recovery. More complete analysis uses:
Project IRR: the return from project cash flows before financing.
Equity IRR: the return to shareholders after financing.
NPV: discounted cash flows less the initial investment.
DSCR: cash available for debt service divided by required debt payments.
LCOS measures storage cost under a specified methodology. Ember’s $65/MWh benchmark excludes charging electricity, so it should not be compared directly with methodologies that include charging costs.
For a proposed battery project, the decisive evidence is the achievable trading margin, enforceable contract income, complete cost scope and annual cash-flow schedule. These determine whether electricity sales translate into sufficient cash to maintain the asset, repay lenders and deliver shareholder returns.
SHAFANA FAZAL