Offshore wind is facing a cost paradox in 2026. The technology has become dramatically cheaper over the long term, yet developers in several major markets are struggling with higher construction costs, financing pressure, supply-chain constraints and weaker project economics.
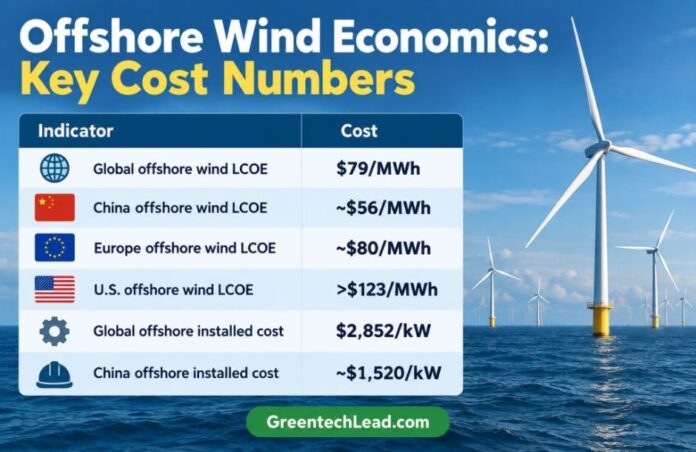
Global weighted-average offshore wind levelized cost of electricity (LCOE) fell 62 percent from $208/MWh in 2010 to $79/MWh in 2024, while total installed costs declined 48 percent from $5,518/kW to $2,852/kW, according to IRENA’s Renewable Power Generation Costs in 2024. However, offshore wind LCOE increased 4 percent in 2024, indicating that inflation, financing and supply-chain pressures are offsetting some earlier efficiency gains.
Regional economics vary sharply. Offshore wind LCOE was approximately $56/MWh in China, $80/MWh in Europe and more than $123/MWh in the United States in 2024.
The result is not a universal offshore wind cost crisis. Instead, the industry is experiencing a widening regional divide in which CAPEX, financing conditions, supply-chain maturity and contract structures determine whether projects remain commercially attractive.
Why a 1 GW Offshore Wind Farm Can Cost More Than $5 Billion
Offshore wind remains one of the most capital-intensive renewable technologies because developers must build considerably more infrastructure than turbines alone.
Projects require offshore foundations, subsea array cables, export cables, offshore substations, onshore grid connections, specialized installation vessels and port infrastructure.
A representative fixed-bottom offshore project has CAPEX of approximately $5,441/kW, equivalent to around $5.44 billion for 1 GW. The NREL offshore wind cost methodology covers turbines, foundations, electrical infrastructure, installation, development, financing and contingencies.
A 10 percent CAPEX increase on a $5.44 billion development would add approximately $544 million to the investment requirement. Additional CAPEX can also mean greater debt or equity requirements and higher lifetime financing costs.
Floating offshore wind faces an even steeper cost curve. NREL’s representative floating project reaches approximately $7,349/kW, equivalent to about $7.35 billion per GW — around 35 percent above the representative fixed-bottom project.
Bigger Turbines Reduce Numbers but Add Complexity
Increasing turbine size has historically helped offshore wind economics.
A 1 GW project using 10 MW turbines would require approximately 100 turbines, while one using 15 MW machines would need about 67. Fewer turbines can mean fewer foundations, cable connections and installation operations.
But larger turbines also require bigger blades, towers, nacelles and foundations. Ports need adequate storage space and load-bearing capacity, while installation vessels require greater lifting capacity and crane height.
The economic benefit therefore depends on whether savings from installing fewer turbines outweigh the additional infrastructure and equipment requirements.
Foundations, cables and vessels also contribute substantially to project CAPEX. Fixed-bottom projects generally use monopiles or jackets, while floating projects require platforms, anchors and mooring systems.
Water depth, seabed characteristics and distance from shore can materially affect costs. Projects farther offshore need longer export cables and additional marine installation work, while shortages of specialized turbine installation and cable-laying vessels can increase costs and delay construction.
Higher Interest Rates Magnify Offshore Wind Costs
Financing is becoming almost as important as turbine and construction costs.
Offshore wind is particularly sensitive to interest rates because billions of dollars can be committed years before commercial electricity revenues begin. A higher weighted average cost of capital raises the lifetime cost of every megawatt-hour generated.
Construction delays compound the problem because developers continue paying financing, contractor, insurance and project-management expenses while the commercial operation date moves further into the future.
The relationship is straightforward:
Higher equipment costs → higher CAPEX → larger financing requirements → higher financing costs → higher LCOE.
This helps explain why technically similar offshore wind farms can have significantly different electricity costs depending on financing conditions and construction schedules.
Ørsted Shows How Delays Can Hit Project Economics
Ørsted provides a clear example of the financial impact of construction delays and cost escalation.
In early 2025, the Danish wind developer announced impairments of approximately DKK 12.1 billion, primarily associated with delays and increased costs at the 924 MW Sunrise Wind project in the United States, as well as higher U.S. financing costs.
Cost escalation involving monopile foundation fabrication and installation contributed to the pressure, while expected commissioning of Sunrise Wind moved to the second half of 2027.
The case demonstrates why offshore wind economics depend on much more than turbine performance. Foundations, construction schedules, financing and supply-chain execution can materially affect returns.
Vattenfall Faced Offshore Wind Cost Increases of Up to 40%
Vattenfall experienced similar pressure when it stopped development of the Norfolk Boreas project in its then-current form.
The Swedish energy company said offshore wind costs had increased by as much as 40 percent and reported a SEK 5.5 billion impairment related to its Norfolk offshore wind projects.
The experience illustrates a weakness in offshore wind auction structures. Developers can secure electricity prices years before construction begins. If turbine, foundation, vessel, labor and financing costs subsequently increase substantially, the contracted electricity price may no longer provide an adequate return.
Empire Wind Shows the Scale of Offshore Investment
Equinor’s Empire Wind 1 demonstrates both the enormous capital requirement of offshore wind and the importance of project financing.
When Equinor reached financial close for Empire Wind 1, it reported expected total capital investment of approximately $5 billion, including the South Brooklyn Marine Terminal and the effect of expected investment tax credits.
The 810 MW project secured more than $3 billion in project financing and has a 25-year power purchase agreement with a strike price of $155/MWh.
Equinor had previously indicated that industry-wide macroeconomic pressures had affected the project and that its expected real base project return was toward the lower end of its 4–8 percent guided range for renewable projects.
China at $56/MWh Reveals the Offshore Wind Cost Divide
Perhaps the most important offshore wind cost story is the widening gap between China and Western markets.
China achieved offshore wind LCOE of approximately $56/MWh in 2024, compared with around $80/MWh in Europe and more than $123/MWh in the United States.
China’s offshore wind installed cost was approximately $1,520/kW, substantially below the $2,852/kW global weighted average.
Large deployment volumes, domestic turbine manufacturing, established component supply chains and extensive industrial infrastructure contribute to China’s cost advantage.
The comparison shows why offshore wind cannot be assessed using one global cost curve. Manufacturing scale, localization, financing conditions and project execution can create dramatically different economics between markets.
1 GW Offshore Wind Economics Show the Profitability Risk
Consider an illustrative 1 GW fixed-bottom offshore wind farm costing $5.44 billion.
At a 45 percent capacity factor, the project would generate approximately 3.94 million MWh annually. At an average realized electricity price of $100/MWh, gross annual electricity revenue would be around $394 million before operating and maintenance expenses, financing, insurance, taxes and grid charges.
A 10 percent CAPEX increase would require another $544 million.
If the capacity factor simultaneously fell from 45 percent to 35 percent, annual generation would decline by approximately 876,000 MWh. At $100/MWh, that represents about $87.6 million in theoretical annual revenue.
These figures demonstrate how relatively modest changes in CAPEX, generation and electricity prices can materially alter project returns.
LCOE Does Not Equal Developer Profitability
LCOE is an important benchmark, but it does not directly represent developer profitability.
A project with an LCOE of $100/MWh and realized electricity revenue of $120/MWh theoretically has a $20/MWh cushion. If construction and financing pressures increase LCOE to $115/MWh, that cushion falls to only $5/MWh.
Actual returns also depend on debt costs, operating expenses, taxes, insurance, curtailment, grid charges, availability and cash-flow timing.
This is why contract structures are becoming important. Developers need mechanisms capable of allocating inflation, construction and financing risks rather than simply rewarding the lowest initial electricity-price bid.
Can Offshore Wind Costs Fall Again?
Despite recent difficulties, offshore wind’s longer-term cost trajectory remains positive.
Global offshore wind LCOE remains 62 percent below its 2010 level, while installed costs have fallen 48 percent.
Future reductions could come from standardized turbine and foundation designs, serial manufacturing, additional installation vessels, stronger port infrastructure, expanded cable manufacturing, coordinated offshore transmission and faster permitting.
Floating wind could similarly benefit from standardized platforms, greater onshore assembly and industrial-scale manufacturing.
However, the experiences of Ørsted, Vattenfall and Equinor show that turbine technology alone will not determine offshore wind profitability.
Financing costs, contract design, construction execution and supply-chain scale are becoming as important as turbine size. That explains the offshore wind paradox in 2026: the technology is substantially cheaper than it was a decade ago, but in several major markets, the financial and industrial conditions required to build the next generation of projects have become considerably more challenging.
SHAFANA FAZAL