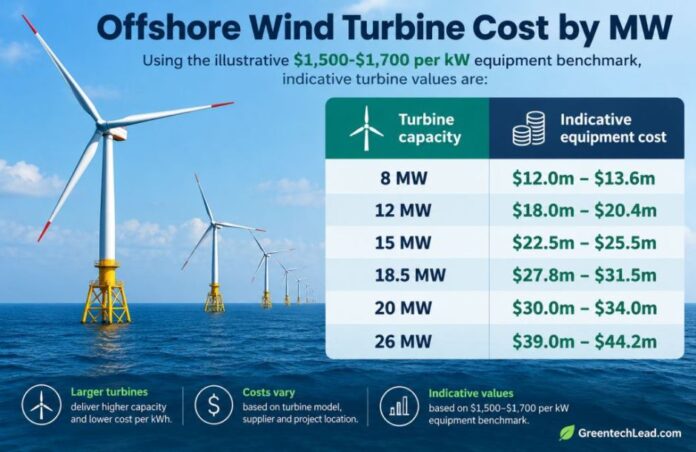
An offshore wind turbine can have an equipment value of roughly $12 million to more than $40 million, depending on capacity, rotor size, technology, supply agreement and market conditions. Using an illustrative equipment benchmark of $1,500-$1,700 per kW, a 15 MW offshore turbine would be worth approximately $22.5 million-$25.5 million.
But the turbine represents only part of offshore wind investment. Foundations, subsea cables, offshore substations, installation vessels, ports, grid connections, development and financing can push the cost of a large wind farm into several billion dollars.
IRENA’s 2026 renewable power cost analysis shows that the economics remain competitive in suitable markets. The International Renewable Energy Agency (IRENA) reported that the global weighted-average offshore wind levelised cost of electricity (LCOE) declined to $78 per MWh in 2025, compared with $33/MWh for onshore wind and $44/MWh for solar PV.
These are illustrative equipment values rather than manufacturer quotations. Actual contracts can include turbines, service agreements, logistics, warranties and other elements that make direct price comparisons difficult.
Turbine size matters because it determines how many machines are needed. A 1 GW project theoretically requires about 125 turbines at 8 MW, 84 at 12 MW, 67 at 15 MW or 50 at 20 MW.
Larger machines therefore have the potential to reduce the number of foundations, cable connections and offshore installation operations.
How Much Does a 1 GW Offshore Wind Farm Cost?
At the 15 MW benchmark, approximately 67 turbines would provide around 1 GW of capacity and represent roughly $1.5 billion-$1.7 billion in indicative turbine equipment value.
The complete wind farm costs substantially more.
IRENA put the global weighted-average installed cost of offshore wind commissioned in 2024 at approximately $2,852 per kW. Applied illustratively to 1 GW, that would equal about $2.85 billion.
Costs vary sharply by market, however. Water depth, distance from shore, seabed conditions, ports, vessels, transmission infrastructure, labour costs, financing and local-content requirements can all affect CAPEX.
U.S. reference models show how high costs can become. NREL’s 2023 representative projects estimated Capex at $5,441/kW for fixed-bottom offshore wind and $7,349/kW for floating wind, equivalent to about $5.44 billion and $7.35 billion respectively on a hypothetical 1 GW basis, NREL’s offshore wind cost reference model shows.
These are reference-model estimates rather than universal market prices.
Where Does the Money Go?
Turbines are highly visible, but offshore wind developers must finance an entire offshore power system.
Major expenses include foundations or floating platforms, inter-array cables, export cables, offshore substations, installation vessels, port facilities, onshore substations and grid connections. Development, engineering, environmental studies, insurance and financing add further costs.
Floating wind adds another layer through floating platforms, anchors, mooring systems and dynamic cables.
This explains why comparing offshore projects only by turbine price can be misleading.
Real Offshore Wind Projects Show the Scale of Investment
Several projects demonstrate how turbine size, project capacity and infrastructure translate into real-world investment.
Hornsea 3: £8.5 Billion for 2.9 GW
Orsted’s Hornsea 3 in the UK is one of the clearest examples of offshore wind moving toward larger turbines and multi-gigawatt projects.
Hornsea 3 is an approximately £8.5 billion infrastructure project with more than 2.9 GW of capacity. It will use 197 Siemens Gamesa SG 14-236 turbines, power-boosted to 15 MW. Each blade is around 115 metres long.
Once operational, Hornsea 3 is expected to generate enough electricity for more than 3.3 million UK homes.
The project demonstrates why turbine price alone cannot explain offshore wind economics: transmission, foundations, offshore converter infrastructure and construction represent major components of total investment.
Sofia Uses 100 Turbines for 1.4 GW
RWE’s Sofia Offshore Wind Farm provides another example of the effect of larger turbines.
The 1.4 GW project on Dogger Bank uses 100 Siemens Gamesa 14 MW turbines. Installation of all turbines was completed in June 2026.
Sofia sits approximately 195 km from the UK coast and includes a roughly 220 km HVDC export cable connecting the offshore converter platform to Teesside.
A project located this far offshore illustrates how transmission distance and marine construction can materially influence costs even when large turbines reduce the total machine count.
Revolution Wind: 65 Turbines for 704 MW
The 704 MW Revolution Wind project off Rhode Island provides a U.S. comparison.
The project uses 65 Siemens Gamesa 11 MW-class turbines and started supplying electricity to New England in March 2026. Installation of its final turbine was completed in September.
Revolution Wind is expected to supply enough electricity for more than 350,000 homes and businesses, with 400 MW contracted to Rhode Island and 304 MW to Connecticut.
These examples show why the industry’s shift toward bigger turbines matters. A larger turbine can increase capacity without proportionally increasing the number of foundations and offshore positions required.
Fixed-Bottom vs Floating Offshore Wind Cost
Fixed-bottom offshore wind remains the dominant commercial technology where water depths allow monopiles or jackets to be attached to the seabed.
Floating offshore wind enables development in deeper waters but remains more expensive.
NREL’s representative 2023 models estimated $5,441/kW CAPEX and $117/MWh LCOE for fixed-bottom wind, compared with $7,349/kW and $181/MWh for floating wind.
The floating premium reflects platforms, anchors, mooring systems, dynamic cables and relatively immature supply chains.
Cost reductions will depend on serial production of floating foundations, standardized designs, larger ports, more specialized vessels and development at commercial scale.
How Much Electricity Does a 15 MW Turbine Generate?
A turbine’s economics depend on annual electricity production rather than rated capacity alone.
A 15 MW offshore turbine would theoretically generate:
52.6 GWh/year at a 40% capacity factor
59.1 GWh/year at 45%
65.7 GWh/year at 50%
72.3 GWh/year at 55%
78.8 GWh/year at 60%
Actual output depends on wind conditions, rotor size, availability, wake losses, maintenance and curtailment.
This is why two turbines with the same MW rating do not necessarily have identical economics.
Why LCOE Matters More Than Turbine Purchase Price
Developers ultimately sell electricity rather than turbines or megawatts.
LCOE measures the lifetime cost of generating electricity and incorporates capital expenditure, operating costs, financing and energy production.
IRENA’s global weighted-average offshore wind LCOE reached $78/MWh in 2025. NREL’s higher U.S. reference values demonstrate how regional supply-chain and project conditions can produce very different economics.
A more expensive turbine may therefore be financially attractive if its larger rotor increases energy production while reducing turbine count, foundations, cable connections and installation cycles.
Offshore Wind Market Reaches 92.5 GW
The economics are increasingly important because offshore wind is becoming a much larger global industry.
The Global Wind Energy Council reported that 9.3 GW of offshore wind was grid-connected in 2025, taking worldwide capacity to 92.5 GW. China alone installed 6.6 GW.
Average turbine capacity installed during 2025 reached 10.3 MW, crossing 10 MW for the first time. More than 50 GW of offshore wind was under construction globally, while GWEC forecasts another 327 GW could be added during the next decade, GWEC’s Global Offshore Wind Report 2026 shows.
That scale should support larger manufacturing runs, stronger supply chains and greater utilization of specialized vessels and ports, although financing costs and supply-chain constraints remain major variables.
Bottom Line: What Does an Offshore Wind Turbine Cost in 2026?
An offshore wind turbine can have an indicative equipment value ranging from about $12 million for an 8 MW machine to more than $40 million for a 26 MW-class turbine. A 15 MW turbine could represent roughly $22.5 million-$25.5 million using the illustrative benchmark in this analysis.
But turbine price should never be confused with project cost.
A 1 GW offshore wind farm can require several billion dollars once foundations, cables, substations, installation, ports, transmission, development and financing are included.
Projects such as Hornsea 3, Sofia and Revolution Wind demonstrate the industry’s strategy: use larger turbines to generate more electricity from fewer offshore positions while reducing the number of foundations and installation cycles.
For developers in 2026, the key question is therefore not simply “How much does the turbine cost?” It is how much electricity the complete offshore wind system can deliver over its lifetime for every dollar invested.
SHAFANA FAZAL