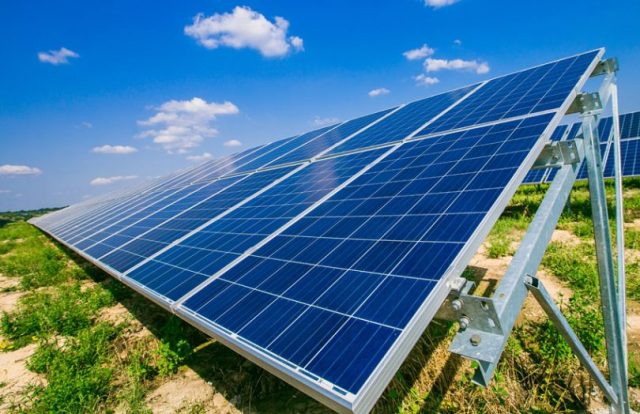
A 100 MW solar farm can generate around ₹65.7 crore in annual gross electricity revenue under a base-case assumption of a 25 percent capacity factor and a realized electricity price of ₹3 per kWh. But revenue can range from below ₹45 crore to more than ₹100 crore depending primarily on solar generation, tariffs, curtailment and project configuration.
For investors and solar developers, gross revenue is only the starting point. Construction cost, operation and maintenance (O&M), financing, land, transmission, degradation, taxes and debt repayment ultimately determine solar farm profit, payback period and return on investment (ROI).
How Much Electricity Does a 100 MW Solar Farm Generate?
A 100 MW solar plant operating continuously at full capacity could theoretically produce:
100 MW × 8,760 hours = 876 GWh per year
Solar plants cannot operate at full output throughout the year because generation changes with irradiation, weather, seasons, equipment availability and grid conditions.
At a 25 percent capacity factor, annual generation becomes:
100 MW × 8,760 × 25% = 219 GWh
That equals 219 million kWh of electricity per year.
At ₹3 per kWh, annual gross revenue is therefore:
219 million kWh × ₹3 = ₹657 million, or ₹65.7 crore.
The capacity-factor assumption is critical. The NREL analysis of utility-scale solar PV shows that capacity factor is affected by solar resource, bifacial modules, albedo, tracking, shading, downtime, DC-to-AC ratio and inverter losses. Historical US utility-scale projects in its dataset had a median AC capacity factor of 24 percent, although individual projects ranged from 9 percent to 35 percent.
100 MW Solar Farm Revenue at Different Capacity Factors
The following scenarios demonstrate how plant performance affects revenue:
| Capacity factor | Annual generation | Revenue at ₹3/kWh |
| 15% | 131.4 GWh | ₹39.42 crore |
| 20% | 175.2 GWh | ₹52.56 crore |
| 25% | 219.0 GWh | ₹65.70 crore |
| 27% | 236.5 GWh | ₹70.96 crore |
| 30% | 262.8 GWh | ₹78.84 crore |
Every one-percentage-point increase in capacity factor adds 8.76 GWh of annual generation to a 100 MW plant. At ₹3 per kWh, that is worth approximately ₹2.63 crore in additional annual gross revenue.
This explains why irradiation, module selection, trackers, bifacial technology, plant availability, cleaning and grid connectivity can have enormous financial consequences.
How Tariffs Change 100 MW Solar Farm Revenue
Electricity price is the second major revenue variable.
Assuming the plant produces 219 GWh annually, revenue changes as follows:
| Realized tariff | Annual revenue |
| ₹2.00/kWh | ₹43.80 crore |
| ₹2.50/kWh | ₹54.75 crore |
| ₹3.00/kWh | ₹65.70 crore |
| ₹3.50/kWh | ₹76.65 crore |
| ₹4.00/kWh | ₹87.60 crore |
| ₹5.00/kWh | ₹109.50 crore |
Every ₹0.10/kWh change in electricity price changes annual revenue by ₹2.19 crore under the 219 GWh generation assumption.
India’s current project pipeline demonstrates why ₹3/kWh should be viewed as an illustrative benchmark rather than a universal solar tariff. SECI’s available-project data includes manufacturing-linked solar tariffs of ₹2.42–₹2.54/kWh, while solar-plus-storage projects have discovered tariffs around ₹3.12–₹3.13/kWh.
At ₹2.42/kWh, for example, a 100 MW project generating 219 GWh would produce approximately ₹53 crore in annual gross revenue, compared with ₹65.7 crore at ₹3/kWh.
India Is Now a 168 GW Solar Market
India’s rapidly expanding solar market provides important context for 100 MW project economics.
According to the Ministry of New and Renewable Energy’s latest capacity data, India’s installed solar capacity reached 168.04 GW by August 31, 2026, including 123.99 GW of ground-mounted solar, 32.59 GW of rooftop solar, 4.83 GW of hybrid capacity and 6.63 GW of off-grid solar.
India added approximately 17.78 GW of solar capacity between April and August 2026 alone, demonstrating the scale at which the industry is expanding.
Competitive bidding, however, places pressure on developers to optimize capital expenditure, financing and plant performance because relatively small changes in tariffs can substantially alter project returns.
How Much Does a 100 MW Solar Farm Cost?
There is no single 2026 construction cost for a 100 MW solar farm. Capital expenditure varies according to module prices, domestic-content requirements, trackers, inverters, land, civil works, grid connection, transmission infrastructure, taxes and financing.
International cost benchmarks nevertheless illustrate the scale of investment.
IRENA’s renewable power cost analysis found that the global weighted-average installed cost of utility-scale solar PV commissioned in 2024 was $691/kW, down 11 percent from 2023 and 87 percent from 2010.
At that global benchmark, 100 MW — or 100,000 kW — would correspond to approximately $69.1 million of installed investment, although actual Indian project costs can differ substantially.
For illustration, consider a 100 MW Indian project costing ₹350 crore. With ₹65.7 crore of first-year revenue, dividing project cost by revenue produces 5.3 years. But 5.3 years is not the project’s true payback period, because revenue is not profit.
How Much Profit Can a 100 MW Solar Farm Make?
A project generating ₹65.7 crore in electricity sales must still pay for:
O&M, module cleaning, security and asset management;
land lease or land-related costs;
insurance;
transmission and grid-related expenses;
inverter and equipment replacement;
taxes and administration;
debt interest and principal repayment; and
additional capital expenditure over the project life.
Consider an illustrative ₹350 crore project financed with 70 percent debt and 30 percent equity. That would mean approximately ₹245 crore of debt and ₹105 crore of equity.
At an illustrative 8 percent interest rate, first-year interest alone could approach ₹19.6 crore, before principal repayment.
Consequently, ₹65.7 crore of revenue cannot be described as ₹65.7 crore of profit.
Investors should instead calculate EBITDA, free cash flow, project IRR, equity IRR, NPV and debt-service coverage ratio.
Revenue Per MW and Per Acre
At the base case, each MW produces approximately 2.19 GWh annually and generates ₹65.7 lakh of gross annual revenue at ₹3/kWh.
Land requirements depend on module efficiency, trackers, terrain, site design and infrastructure. Using a broad planning assumption of 3–5 acres per MW, a 100 MW project could occupy approximately 300–500 acres.
At ₹65.7 crore of annual revenue, revenue density would therefore be approximately:
300 acres: ₹21.9 lakh per acre
400 acres: ₹16.4 lakh per acre
500 acres: ₹13.1 lakh per acre
These figures represent gross electricity revenue allocated across the project’s land footprint — not landowner income or profit per acre.
Solar Costs Remain Highly Competitive
The economics of utility-scale solar have changed dramatically over the past decade.
IRENA reports that the global weighted-average LCOE for utility-scale solar PV reached approximately $43/MWh in 2024, around 90 percent below its 2010 level. India’s weighted-average solar LCOE was even lower at approximately $38/MWh, compared with $33/MWh in China.
Around 91 percent of new utility-scale renewable capacity commissioned globally in 2024 produced electricity more cheaply than the cheapest new fossil-fuel alternative.
LCOE, however, measures lifetime electricity-production cost. It should not be confused with a project’s PPA tariff or revenue.
Can Battery Storage Increase Solar Farm Revenue?
Storage is becoming increasingly relevant because the value of solar electricity depends not only on how many MWh are generated but also when they are sold.
A battery allows a solar farm to store electricity during high-generation periods and discharge it during higher-value evening or peak-demand periods.
Battery economics have improved dramatically. IRENA estimates that fully installed utility-scale battery storage costs dropped 93 percent between 2010 and 2024, from $2,571/kWh to $192/kWh.
India’s market is already moving toward this model. SECI’s solar-plus-BESS portfolio includes projects with contracted CUFs of roughly 25–28 percent and tariffs of ₹3.12–₹3.13/kWh.
Storage does not automatically increase profit, however. Additional revenue from energy shifting, capacity and grid services must exceed battery investment, efficiency losses, degradation and financing costs.
Degradation and Curtailment Affect Lifetime Returns
Multiplying first-year revenue by 25 years can seriously overstate lifetime project revenue.
NREL’s utility-scale PV baseline assumes 0.7 percent annual degradation, while its technology scenarios examine improvements to 0.5 percent and 0.2 percent.
At the base case, ₹65.7 crore multiplied by 25 years equals ₹1,642.5 crore. That is only a mathematical reference. Actual lifetime revenue will depend on degradation, tariff escalation, curtailment, availability and equipment performance.
Curtailment can be particularly expensive. At ₹3/kWh, every 1 GWh of electricity that cannot be sold costs approximately ₹30 lakh in gross revenue.
Grid access should therefore be treated as an investment variable rather than merely a technical consideration.
What Is the ROI of a 100 MW Solar Farm?
There is no universal ROI for a 100 MW solar farm.
A high-performing plant with a strong PPA, competitive construction cost, inexpensive debt and limited curtailment can produce substantially better equity returns than an identical-sized project with weaker irradiation, higher financing costs or poor grid availability.
For a 2026 financial model, investors should stress-test at least three scenarios:
Downside: 20% capacity factor × ₹3/kWh = ₹52.56 crore/year
Base case: 25% capacity factor × ₹3/kWh = ₹65.70 crore/year
Upside: 30% capacity factor × ₹3/kWh = ₹78.84 crore/year
Tariff sensitivity should then be layered onto these generation scenarios. At a 25 percent capacity factor, moving from ₹2/kWh to ₹4/kWh changes revenue from ₹43.8 crore to ₹87.6 crore.
That ₹43.8 crore difference demonstrates why the combination of generation, tariff, capex and financing — rather than installed MW alone — determines solar farm valuation.
100 MW Solar Farm Revenue in 2026: Final Answer
A 100 MW solar farm generating 219 GWh annually can produce around ₹65.7 crore in gross annual revenue at ₹3 per kWh.
At the same tariff, revenue falls to approximately ₹52.56 crore at a 20 percent capacity factor and rises to ₹78.84 crore at 30 percent.
At a 25 percent capacity factor, electricity pricing creates an even wider range: revenue is ₹43.8 crore at ₹2/kWh, ₹65.7 crore at ₹3/kWh, ₹87.6 crore at ₹4/kWh and ₹109.5 crore at ₹5/kWh.
But revenue is not profit. A credible 100 MW solar farm investment model must include construction cost, O&M, debt, interest, taxes, degradation, curtailment, transmission, equipment replacement and PPA terms.
For developers and investors, the most important question is therefore not simply “How much revenue does a 100 MW solar farm generate?” It is how much cash remains after producing, financing and delivering that electricity — because that ultimately determines profit, payback period, project IRR and equity ROI.
SHAFANA FAZAL