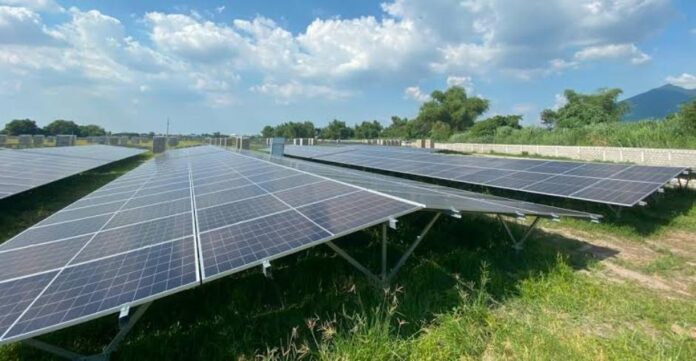
A 1 GW utility-scale solar power project can cost roughly $500 million to $1 billion or more in 2026, depending on the country, equipment prices, DC-to-AC configuration, land, construction, grid connection and financing. The International Renewable Energy Agency’s global benchmark of $691/kW translates into approximately $691 million for a 1 GW DC solar project, while the global cost range shows projects can vary from about $489 million to $1.61 billion.
The investment calculation is increasingly important as solar developers move beyond module prices and focus on the complete economics of building, connecting and financing large-scale projects.
IRENA’s latest data also show that solar remains highly competitive: the global weighted-average levelized cost of electricity for utility-scale solar PV was around $44/MWh in 2025.
1 GW Solar Project Cost: $691 Million Global Benchmark
IRENA reported a global weighted-average installed cost of $691/kW for utility-scale solar PV projects commissioned in 2024.
Since 1 GW equals one million kW, the benchmark translates directly into:
1 GW × $691/kW = $691 million
But $691 million should not be treated as a universal EPC price.
IRENA’s fifth-to-95th-percentile range was approximately $489-$1,610/kW, which means a 1 GW DC project could range from around $489 million to $1.61 billion depending on market and project conditions.
The IRENA renewable power generation cost analysis provides one of the most useful international benchmarks for comparing utility-scale solar investments.
India Solar Cost: Around $525 Million per GW
Location creates enormous differences in solar investment requirements.
IRENA reported average 2024 utility-scale solar installed costs of approximately:
India — $525/kW
China — $591/kW
Global average — $691/kW
United States — $1,058/kW
For a 1 GW DC project, these figures imply approximately $525 million in India, $591 million in China and $1.058 billion in the United States.
These differences reflect more than module prices. Labor, domestic supply chains, permitting, land, taxes, logistics, financing conditions and grid infrastructure can materially affect total project cost.
For investors, the comparison demonstrates why applying a single global $/MW figure to every solar market can produce misleading investment estimates.
Modules Are Only Part of the Solar Investment
Falling solar module prices can attract attention, but modules represent only part of a utility-scale project’s investment.
A 1 GW plant also requires inverters, mounting systems or trackers, foundations, cables, transformers, switchgear, monitoring equipment, substations, roads, drainage, fencing and grid infrastructure.
Engineering, procurement, construction, land development, environmental assessments, permitting and project management add another layer.
IRENA estimates that balance-of-system costs excluding modules and inverters represented around 65 percent of total installed utility-scale PV costs in 2024.
This is one of the most important lessons for solar investors: a 20 percent decline in module prices does not mean the complete project becomes 20 percent cheaper.
1 GW AC Can Require 1.34 GW of Solar Modules
Another major issue is whether the project’s stated capacity refers to DC or AC.
Solar modules produce DC electricity, while inverters convert it into AC electricity supplied to the grid.
The NREL utility-scale solar methodology uses a representative 1.34 DC-to-AC ratio for its one-axis tracking configuration.
Under this configuration, a plant designed for 1 GW AC output would have approximately 1.34 GW DC of modules.
At an illustrative module price of:
$0.15/W: modules cost about $201 million
$0.18/W: about $241.2 million
$0.20/W: about $268 million
Every $0.01/W movement in module prices changes procurement cost by approximately $13.4 million for 1.34 GW DC.
This makes procurement timing an important factor in the economics of giga-scale solar developments.
Grid Connection Can Change Solar Project Economics
Transmission is one of the most underestimated components of solar investment.
A 1 GW plant needs infrastructure capable of transferring enormous amounts of electricity to the grid. Depending on the project, this can require high-voltage substations, transformers, switchgear and new transmission lines.
A project located close to an available high-capacity substation can have a substantial cost advantage over a remote project.
Conversely, inexpensive land and excellent solar irradiation may not compensate for the cost of building a long transmission connection.
For developers, grid availability should therefore be evaluated alongside solar irradiation and land prices before selecting a site.
This issue is becoming more important as renewable penetration rises and transmission capacity becomes increasingly constrained in major solar markets.
Trackers Can Raise CAPEX but Increase Generation
Utility-scale solar projects also need to choose between fixed-tilt mounting and tracking systems.
Single-axis trackers increase capital and maintenance requirements because they use mechanical systems to follow the sun.
The investment can be justified if the additional electricity production increases project revenue sufficiently over the plant’s lifetime.
Terrain matters as well. Flat land can reduce grading and foundation expenditure, while rocky, uneven or flood-prone locations can add millions of dollars to civil costs.
At 1 GW scale, even a seemingly small $20/kW increase adds $20 million to project CAPEX.
Adding Battery Storage Can Push Investment Above $1 Billion
Solar-plus-storage changes the project economics considerably.
IRENA’s global weighted-average utility-scale battery storage installed cost was approximately $192/kWh in 2024, representing a 93 percent decline from 2010.
At that benchmark:
500 MWh BESS — approximately $96 million
1 GWh BESS — approximately $192 million
2 GWh BESS — approximately $384 million
Using the $691 million global solar benchmark, a 1 GW solar project combined with 2 GWh of battery storage could represent approximately $1.075 billion of investment before project-specific adjustments.
The IRENA battery storage cost analysis demonstrates how dramatically storage economics have improved.
Actual BESS investment depends on battery chemistry, MW rating, storage duration, cooling, augmentation, power conversion, energy-management software and grid infrastructure.
Storage can nevertheless create additional value by shifting low-cost daytime solar electricity into evening demand periods and providing grid services.
Financing Can Add Tens of Millions of Dollars
The installed-cost benchmark does not necessarily equal the total funding requirement.
Large solar projects frequently use substantial project debt, meaning interest rates can materially affect investment returns.
For illustration, a $700 million development financed with 70 percent debt would require $490 million of borrowing. At a hypothetical 7 percent annual interest rate, simple first-year interest would equal approximately $34.3 million.
Actual financing costs depend on debt drawdown, construction periods, interest rates, hedging and financing fees.
This explains why two technically identical solar projects can produce different returns when one developer has access to cheaper capital.
Solar O&M Costs About $13 Million Annually per GW
Construction is not the end of the investment calculation.
IRENA reported average utility-scale solar operations and maintenance costs of approximately $13.1/kW annually in 2024.
For 1 GW, that equals approximately $13.1 million per year. A simple 25-year calculation produces about $327.5 million, before considering inflation, escalation and major equipment replacement.
O&M should not be included in headline construction CAPEX, but it matters when investors calculate lifetime project returns and LCOE.
Solar LCOE Holds at $44/MWh
IRENA’s Renewable Power Generation Costs in 2025 puts the global weighted-average solar PV LCOE at approximately $44/MWh in 2025, broadly unchanged from 2024.
That suggests the next phase of solar cost optimization will increasingly depend on factors beyond cheaper modules.
Developers need to focus on EPC execution, financing, land, grid connections, trackers, plant design, procurement and capacity utilization.
How Much Should Developers Budget for 1 GW Solar in 2026?
For early-stage investment planning, $500 million-$1 billion provides a practical broad range for a 1 GW utility-scale solar project, while IRENA’s $691 million global benchmark for 1 GW DC offers a useful central reference.
India’s approximately $525 million/GW benchmark demonstrates what mature, lower-cost markets can achieve, while the U.S. benchmark of around $1.06 billion/GW illustrates how market conditions can push investment considerably higher.
Storage can add hundreds of millions more. At the $192/kWh benchmark, 2 GWh of batteries adds approximately $384 million.
For investors, therefore, the most important question is not simply “How much does 1 GW of solar cost?”
A realistic investment model must establish whether capacity is AC or DC, then price modules, inverters, trackers, balance-of-system infrastructure, EPC, land and grid connection. Storage, financing and lifetime O&M should then be evaluated separately.
That approach provides a much more meaningful measure of the capital required — and the potential returns — from a 1 GW solar power investment in 2026.
SHAFANA FAZAL
Solar Module Manufacturing Cost 2026: Why China Is 10 percent Cheaper Than India and 35 percent Below Europe
China remains the world’s lowest-cost solar manufacturing hub in 2026, with production costs around 10 percent below India, 20 percent below the United States and 35 percent below Europe. The advantage is driven less by cheap labor than by massive scale, vertical integration, high factory utilization, supplier concentration and access to a mature upstream ecosystem covering polysilicon, wafers, cells and modules.
For India, the US and Europe, the solar manufacturing race is therefore becoming more complicated than simply adding gigawatts of module capacity. Competitiveness increasingly depends on cost per watt, factory utilization, electricity prices, upstream integration, technology and government incentives.
China Sets the Global Solar Manufacturing Cost Benchmark
The International Energy Agency identifies China as the most cost-competitive manufacturing location across the major stages of the solar PV supply chain.
Compared with China, manufacturing costs are approximately:
India — 10 percent higher
United States — 20 percent higher
Europe — 35 percent higher
The IEA solar PV manufacturing cost data provide an important benchmark because they examine production economics rather than simply comparing market selling prices.
China’s advantage comes from an enormous integrated manufacturing ecosystem. It accounts for around 85 percent of global solar supply-chain production capacity and approximately 95 percent of PV wafer capacity.
Large manufacturers also operate at extraordinary scale. LONGi shipped 29.93 GW of modules and 48.91 GW of wafers in H1 2026, while JinkoSolar shipped 29.6 GW of modules. Such volumes allow manufacturers to spread depreciation, R&D, engineering and overhead across billions of watts of production.
Solar Manufacturing Cost Is More Than Module Assembly
The biggest misconception in comparing countries is focusing only on the final module factory.
Solar manufacturing begins upstream with polysilicon, ingots, wafers and cells. Final module production then requires glass, aluminum, encapsulants, junction boxes, interconnects and other materials.
Factories also carry costs for electricity, labor, equipment depreciation, financing, maintenance and quality control.
Electricity is especially significant upstream. The IEA estimates that power accounts for more than 40 percent of polysilicon manufacturing costs and nearly 20 percent of ingot and wafer costs.
This explains why a country can establish module assembly relatively quickly but still struggle to compete with China on fully integrated manufacturing costs.
India Is Only 10 percent Above China — But Faces an Upstream Challenge
India is emerging as China’s most significant large-scale solar manufacturing competitor among the regions compared.
The approximately 10 percent manufacturing cost premium over China is considerably smaller than the US or European gap.
But India’s challenge lies upstream.
A 2026 CEEW analysis found that bill-of-materials costs are responsible for a substantial share of the manufacturing-cost difference between India and China. Solar cells are particularly important because they represent a major portion of finished-module value.
Indian companies can manufacture modules domestically while remaining dependent on imported cells, wafers or other inputs. That limits the cost and supply-chain benefits of localization.
India is consequently moving toward greater vertical integration involving cells, wafers and ingots, rather than focusing exclusively on modules.
Manufacturers including Waaree Energies, Adani Solar, Premier Energies, Tata Power Solar, Vikram Solar and Emmvee are expanding the domestic ecosystem.
The CEEW research on India’s solar manufacturing ecosystem provides useful analysis of how materials, upstream integration and localization affect India’s competitiveness.
India’s 233 GW Capacity Creates an Utilization Problem
India’s manufacturing expansion has been extremely rapid.
An IEEFA-JMK Research assessment put domestic module manufacturing capacity at around 233 GW in 2026, with another 135 GW under development or construction.
However, factories were operating at only around 35-40 percent utilization, compared with an estimated sustainable range of roughly 50-65 percent.
That matters enormously to manufacturing economics.
Consider two identical 5 GW factories. If one operates at 80 percent utilization and the other at 40 percent, the lower-utilization facility has roughly half as much production over which to spread depreciation, maintenance, financing and overhead.
India’s solar manufacturing challenge is therefore shifting from “How many GW can we build?” to “How many GW can we manufacture competitively and sell?”
Expanding nameplate capacity faster than domestic and export demand could actually weaken cost competitiveness by reducing factory utilization.
US Manufacturing Costs 20 percent More Than China
The US follows a fundamentally different solar manufacturing strategy.
Its physical manufacturing costs are approximately 20 percent higher than China’s, reflecting higher labor, construction, capital and operating expenses.
But direct factory cost does not tell the full story.
The US uses incentives such as the Section 45X Advanced Manufacturing Production Credit to improve domestic production economics. Trade measures and domestic-content rules can further improve the relative position of US-made products against imports.
This means a US module can have a higher physical production cost while achieving more competitive economics after incentives.
Qcells is expanding crystalline-silicon manufacturing in Georgia, while First Solar operates a vertically integrated thin-film model based on cadmium telluride technology.
The US model can therefore be described as higher manufacturing cost supported by production incentives, domestic-content value and trade policy.
Europe Faces the Largest Solar Manufacturing Cost Gap
Europe has the toughest manufacturing economics.
Solar manufacturing costs are approximately 35 percent higher than in China, according to the IEA benchmark.
High industrial electricity prices, labor costs, financing expenses and a smaller upstream supplier ecosystem contribute to the premium.
The problem becomes particularly acute in energy-intensive polysilicon, ingot and wafer manufacturing.
But Europe may not need to manufacture every component domestically.
IEA analysis indicates that producing solar modules in the European Union using wafers imported from North Africa could cost almost 20 percent less than manufacturing a completely EU-made module.
That could point toward a regional manufacturing strategy in which Europe concentrates on high-value cells, modules and advanced technologies while sourcing selected upstream components from lower-cost neighboring markets.
The question is therefore shifting from complete localization toward which parts of the solar value chain Europe can manufacture competitively.
Factory Utilization Could Decide the Winners
Manufacturing capacity attracts headlines, but utilization ultimately determines how effectively that capacity absorbs fixed costs.
China has the world’s deepest and most efficient solar manufacturing ecosystem, but its massive expansion has produced oversupply. Solar PV prices in China have fallen more than 60 percent since 2023, contributing to negative margins and significant losses at manufacturers.
This creates an important distinction:
Lowest manufacturing cost does not necessarily mean highest profitability.
India faces the reverse risk. It has rapidly growing manufacturing capacity but relatively low utilization.
The ideal manufacturing position is therefore not maximum capacity. It is high utilization + low input costs + high efficiency + competitive selling prices.
TOPCon, HJT and Back-Contact Change the Cost Equation
Technology is adding another dimension to competition.
TOPCon has become a major crystalline-silicon technology because it combines higher efficiency with relatively strong compatibility with established manufacturing infrastructure.
HJT requires a different production process but offers another route toward higher efficiency. Back-contact technologies can improve conversion efficiency by removing front-side electrical contacts.
The relevant measure is consequently cost per watt, not cost per module.
A higher-efficiency module can potentially reduce project-level costs because developers may require fewer modules, mounting structures, cables and less land to achieve the same generating capacity.
Future manufacturing leadership will therefore depend on simultaneously reducing production costs and increasing module efficiency.
Manufacturing Cost and Module Selling Price Are Different
Another important distinction for investors is the difference between manufacturing cost and selling price.
Manufacturing cost represents what it takes to produce a module.
Factory-gate pricing includes commercial expenses and margins, while delivered pricing can add shipping, insurance, tariffs and other costs.
During periods of severe oversupply, manufacturers can even sell products near or below sustainable economic cost to maintain utilization or clear inventories.
Comparing Chinese spot module prices directly with the production cost of an Indian, American or European factory can therefore produce misleading conclusions.
China vs India vs US vs Europe: Who Has the Advantage?
The 2026 solar manufacturing race reveals four distinctly different strategies.
China has the lowest structural cost through scale, vertical integration, automation, supplier density and manufacturing experience.
India is only about 10 percent more expensive but needs deeper upstream integration and higher factory utilization to narrow the gap further.
United States operates with approximately a 20 percent physical cost premium but uses manufacturing incentives and trade policy to improve domestic economics.
Europe faces the largest structural disadvantage at approximately 35 percent but could reduce costs through regional specialization rather than attempting complete localization.
The biggest competitive variable over 2026-2027 may therefore be sustainable manufacturing cost per watt, rather than announced factory capacity.
China still holds the strongest cost position. But India’s rapid manufacturing expansion, US incentives and Europe’s push for strategic supply-chain resilience show that global solar manufacturing is becoming less concentrated in strategy, even if China remains dominant in actual production.
The next stage of competition will be won not by the country that announces the most factories, but by manufacturers that can produce high-efficiency modules at the lowest sustainable cost per watt while keeping factories highly utilized and supply chains secure.
SHAFANA FAZAL