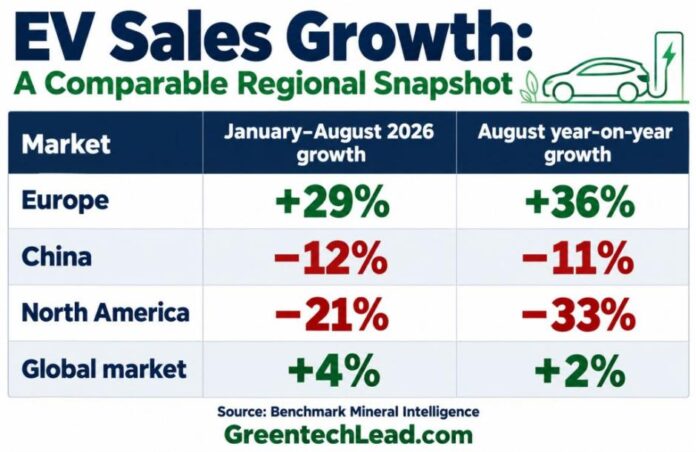
Europe is recording the strongest EV sales growth among the three major markets in 2026, while China remains the largest market and the United States faces weaker demand.
The distinction between growth and scale matters. A market can retain high electric-vehicle adoption while selling fewer cars than a year earlier. China illustrates this pattern: electric models account for a substantial share of purchases, but domestic demand has softened.
Europe’s growth reflects expanding affordable model choices, incentives and emissions requirements. In the US, the withdrawal of federal purchase support and comparisons with last year’s incentive-driven buying rush have weighed on sales.
EV Sales Growth: A Comparable Regional Snapshot
Benchmark Mineral Intelligence’s August 2026 EV market update provides a consistent comparison of electric vehicles, including battery-electric vehicles and plug-in hybrids.
Global sales reached 13.4 million through August, including 1.83 million during August. North America includes markets beyond the US and should not be presented as a US-only total.
Separately, October reporting put US EV sales 30.7 percent lower through September, with market share falling to 6 percent from 8.5 percent. Europe’s reported EV share rose to 23.2 percent from 17.7 percent. These figures belong to a separate reporting series and should not be combined directly with the plug-in totals above.
China Leads in Volume Despite Softer Domestic Sales
China’s leadership rests on an established manufacturing ecosystem and substantial domestic adoption.
The IEA’s Global EV Outlook 2026 reports that electric cars accounted for nearly 55 percent of Chinese car sales in 2025. Globally, electric-car sales exceeded 20 million, representing approximately one-quarter of new cars sold.
The IEA forecasts 23 million global electric-car sales in 2026, or 28 percent of total sales. That is a full-year projection, rather than a completed sales result.
China’s 2026 slowdown therefore reflects weaker sales momentum rather than the disappearance of electric mobility. Benchmark reported that EV penetration remained above 60 percent for a fourth consecutive month in August, despite lower year-on-year volumes.
For manufacturers, high adoption does not automatically deliver rising profits. Competition, discounts and factory utilisation remain important when overall demand weakens.
Chinese Manufacturing Strength Supports Export Expansion
China produced approximately 16 million electric cars in 2025, while electric-car exports exceeded 2.5 million, according to the IEA.
Its supply-chain position is similarly strong: China accounted for more than 80 percent of battery-cell production, approximately 85 percent of cathode active-material production, and more than 90 percent of anode active-material production used in electric-car batteries.
This concentration connects materials, batteries, electronics and vehicle assembly within an extensive industrial network.
BYD illustrates how overseas markets can support expansion. The company reported more than one million overseas vehicle sales in 2025, up 145 percent year on year. This company total should not be confused with battery-electric sales alone.
Exports provide additional demand, but overseas retail prices also include shipping, duties, distribution and after-sales support. Domestic manufacturing advantages do not transfer unchanged into every market.
Europe’s Growth Depends on Affordable Models
Europe’s expansion depends on vehicles that fit mainstream household budgets.
The IEA’s electric-car affordability analysis identifies the Renault 5 E-Tech, Hyundai Inster and new Chinese models among the additions improving choice.
Germany’s average battery-electric car price declined approximately 6 percent in 2025. Nevertheless, affordability remains uneven: fewer than 10 percent of European BEV models had entry prices below $30,000, compared with approximately 25 percent of conventional-car models.
Compact vehicles can support adoption without requiring the large batteries used in premium SUVs. Lower-priced trims also allow manufacturers to reach buyers who previously considered EVs beyond their budgets.
Europe’s growth creates an industrial challenge alongside the sales opportunity. EU electric-car imports increased approximately 35 percent to more than 900,000 in 2025, with China supplying almost 60 percent.
European manufacturers therefore face pressure to deliver competitive products while improving local production costs.
US Demand Weakens, but Individual Manufacturers Can Grow
The US market demonstrates how incentives and purchasing timing influence annual comparisons.
Benchmark attributed part of North America’s steep August decline to comparison with the buying surge before US federal EV tax credits expired at the end of September 2025. A negative annual comparison can therefore coexist with improving month-to-month sales.
Rivian provides a contrasting company example. Its October production and delivery announcement reaffirmed 2026 delivery guidance of 65,000–70,000 vehicles. Rivian’s R2 production launch also expands its product offering. These developments show why market-wide weakness should not be applied uniformly to every manufacturer.
For US automakers, competitive purchase prices, financing offers and convenient charging remain central to attracting buyers.
Battery Costs Connect Manufacturing With Consumer Prices
BloombergNEF’s 2025 battery price survey recorded average lithium-ion pack prices of $108/kWh, down 8 percent.
Battery-electric vehicle packs averaged $99/kWh, while China’s regional average across applications was $84/kWh.
At an illustrative $99/kWh, a 40-kWh pack represents $3,960, compared with $7,920 for 80 kWh. The $3,960 difference helps explain why battery size influences affordability.
These are simplified pack calculations, excluding the rest of the vehicle. Manufacturers must balance range, efficiency and price rather than assuming larger batteries always improve customer value.
Emerging Markets Add Another Source of Growth
Europe leads growth among the three major markets, but expansion is extending elsewhere.
The IEA reports that electric-car sales in India increased 75 percent to approximately 165,000 in 2025. Thailand recorded around 140,000, up 70 percent, while Brazil reached approximately 180,000. These totals include plug-in hybrids where applicable.
Different market conditions create different opportunities. Domestic manufacturing supports India’s development, while Thailand combines imports with expanding local assembly. Brazil’s market includes a substantial plug-in hybrid segment.
What Determines the 2026 EV Sales Leaders?
Europe currently leads sales growth among the major markets, China retains industrial scale and high adoption, and the US faces a more difficult demand environment.
For automakers, the useful measures extend beyond headline sales: affordable model availability, manufacturing costs, margins and customer access to charging determine whether growth can continue.
For readers comparing regions, the essential discipline is to keep periods, geography and powertrain definitions consistent. Battery-electric sales, total plug-in sales and forecasts describe different parts of the EV market.
SHAFANA FAZAL