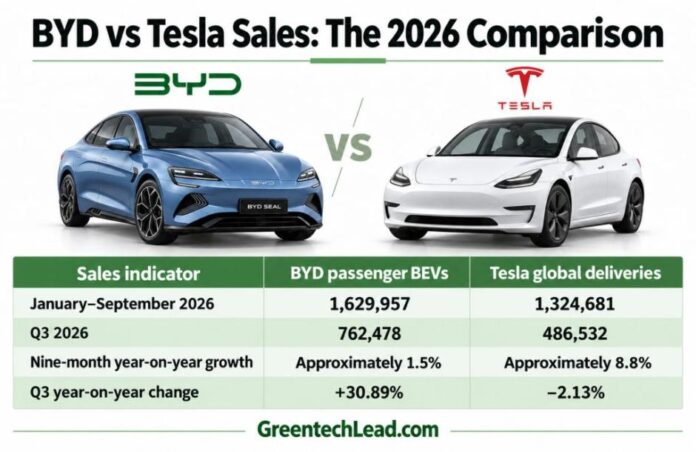
BYD is ahead of Tesla in battery-electric vehicle sales through September 2026, but the competition extends beyond vehicle volumes. Battery costs, international manufacturing, charging access and recurring software revenue are shaping how the two companies pursue growth.
BYD sold 1,629,957 passenger battery-electric vehicles (BEVs) during the first nine months of 2026, compared with 1,324,681 global Tesla deliveries. That puts BYD ahead by 305,276 vehicles, or approximately 23 percent.
The companies are competing in an expanding market. The IEA’s Global EV Outlook 2026 forecasts 23 million electric-car sales in 2026, representing 28 percent of global car sales. This market forecast includes battery-electric cars and plug-in hybrids.
BYD vs Tesla Sales: The 2026 Comparison
A meaningful comparison must separate BYD’s battery-electric vehicles from its plug-in hybrids. Tesla sells fully electric vehicles, while BYD’s wider sales totals include both technologies.
BYD’s third-quarter lead reached 275,946 vehicles, accounting for most of its cumulative advantage through September. Its quarterly passenger-BEV sales increased 36.87 percent sequentially, indicating a substantial acceleration.
Tesla recorded faster percentage growth over the nine-month period, although its Q3 deliveries remained below the corresponding quarter of 2025. These results show why quarterly momentum and cumulative sales should be assessed separately.
BYD’s EV Portfolio Supports Manufacturing Scale
BYD competes across multiple price categories through battery-electric vehicles and plug-in hybrids. That breadth gives it more opportunities to serve buyers with different budgets, driving patterns and access to charging.
Plug-in hybrids also provide a route into markets where charging infrastructure remains limited. However, their sales should remain separate when assessing which company leads the fully electric segment.
Tesla’s business is more concentrated. Model 3 and Model Y accounted for 478,237 of its 486,532 Q3 deliveries, approximately 98.3 percent, according to Tesla’s Q3 2026 production and delivery results. Tesla Investor Relations
This concentration supports production standardization but makes demand for those two models particularly important. BYD’s wider portfolio spreads its commercial opportunities across more vehicle segments, while adding complexity to manufacturing, distribution and inventory management.
Battery Integration Strengthens BYD’s Cost Strategy
Battery economics remain central to electric-car affordability. Cell costs, pack design, energy efficiency and manufacturing yields influence how competitively automakers can price their vehicles.
BYD combines battery development with vehicle and component manufacturing. Its Blade Battery technology forms part of a broader approach that integrates batteries, electric powertrains and vehicle platforms.
That integration can help coordinate product design and production costs. During price competition, manufacturing efficiencies create room to reduce prices, improve specifications or protect margins.
However, integration alone does not prove superior profitability. Factory utilization, warranty costs, product mix and selling prices determine how much of any manufacturing advantage reaches the bottom line.
Tesla also brings substantial experience in electric powertrains, vehicle efficiency and large-scale manufacturing. Comparing the companies’ cost positions ultimately requires financial results alongside delivery figures.
Tesla’s Charging Ecosystem Adds Customer Value
Tesla’s charging infrastructure and integration of navigation, charging and vehicle software remain important elements of its ownership proposition.
For drivers, charging convenience depends on more than maximum charging speed. Station coverage, reliability, waiting times, pricing and compatibility can all influence whether an electric vehicle suits everyday travel.
BYD’s battery and vehicle technology strengthens its product offering, but international growth also requires dependable charging arrangements, service networks and spare-parts availability.
As competing charging networks expand, both companies must demonstrate how their vehicles reduce the time, cost and inconvenience associated with electric-car ownership.
Energy Storage Broadens Tesla’s Growth Opportunities
Tesla deployed 13.7 GWh of energy-storage products in Q3 2026, demonstrating the scale of a business that operates alongside vehicle manufacturing.
Energy storage gives Tesla exposure to demand from utilities, renewable-energy developers and customers seeking backup power. Its software and autonomous-driving investments could also generate additional revenue beyond the initial vehicle sale.
Those opportunities require separate evaluation. Storage deployments do not establish storage profitability, while autonomous-driving revenue depends on technical performance, regulatory approvals, customer adoption and commercial execution.
Tesla’s Q3 financial results are scheduled for October 21, 2026. Until then, delivery and deployment figures provide an incomplete picture of quarterly margins and cash flow.
BYD’s Overseas Expansion Brings New Execution Risks
The supplied report states that BYD’s September global vehicle sales reached 463,561, up 17 percent year on year. Overseas passenger-vehicle and pickup shipments increased 153.9 percent to 179,877.
These broader figures include categories beyond passenger BEVs and should not be compared directly with Tesla deliveries.
International expansion can diversify BYD’s demand and increase manufacturing scale. Local production may improve delivery times and help address market-access requirements.
Nevertheless, export shipments are different from sales to final customers. Sustained growth requires dealers to sell inventory, customers to receive reliable service and factories to operate at commercially viable utilization levels.
Tariffs, local-content requirements and localization costs can also affect overseas returns.
Who Is Winning the BYD vs Tesla EV Race?
BYD leads the battery-electric vehicle volume comparison through September 2026, with a gap exceeding 305,000 vehicles. Its strong third quarter, broader portfolio and integrated manufacturing strategy support that position.
Tesla remains a major competitor with substantial vehicle deliveries, an established charging ecosystem and a growing energy-storage business. Its longer-term opportunity depends partly on converting software and autonomous-driving investments into profitable revenue.
The full-year sales contest remains open until fourth-quarter results are available. A broader judgment of business performance will require comparable evidence on automotive margins, cash flow, overseas profitability and returns on investment.
For buyers, the decisive comparison is practical: purchase price, driving efficiency, charging access, servicing, insurance and resale value. For the companies, leadership will depend on turning sales growth and technology investment into durable financial returns.
SHAFANA FAZAL