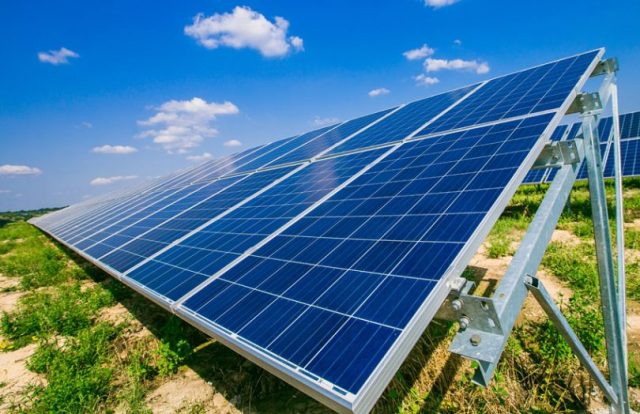
Solar power purchase agreement (PPA) prices have fallen below $20/MWh in some of the world’s most competitive renewable-energy markets. Saudi Arabia has recorded utility-scale solar tariffs around $13/MWh, while China and India have some of the world’s lowest underlying solar generation costs.
But the lowest PPA does not necessarily mean the cheapest electricity — or the most profitable solar project.
Capital expenditure, irradiation, capacity factor, financing, PPA duration, transmission charges, curtailment, battery storage and buyer creditworthiness can completely change project economics.
Global Solar Capacity Reaches 2.96 TW
According to the IEA PVPS Trends in Photovoltaic Applications 2026 report, approximately 690 GW of photovoltaic capacity was installed worldwide in 2025, increasing global cumulative PV capacity to 2.96 TW.
China accounted for 415 GW, around 60 percent of global installations. India followed with 54 GW, ahead of the United States at 43 GW, Germany at 18 GW and Pakistan at around 14 GW.
Solar’s enormous scale has reduced equipment costs, but it has also created new challenges. When hundreds of GW generate simultaneously, wholesale electricity prices can fall sharply during sunny hours, increasing the importance of grid congestion, curtailment, storage and solar capture prices.
Which Countries Have the Cheapest Solar PPA Prices?
The Middle East has produced many of the world’s lowest utility-scale solar tariffs.
Saudi Arabia has recorded solar tariffs around $12.9/MWh, demonstrating what is possible when excellent irradiation, inexpensive financing, large projects, competitive procurement and access to land and transmission infrastructure come together.
But international PPA comparisons require caution.
A government-backed 25-year solar contract in Saudi Arabia is fundamentally different from a shorter corporate PPA in Germany, France, Ireland or Italy. Financing, taxation, grid costs, inflation indexation, currency exposure and credit risk can all differ.
The lowest announced tariff should therefore be treated as a project-specific price rather than a national electricity-cost benchmark.
Solar PPA Price vs LCOE
PPA price and levelised cost of electricity, or LCOE, measure different things.
A PPA is the contractual price paid for electricity. LCOE estimates the average lifetime cost of generating electricity based on capital expenditure, operating expenses, output, financing and project life.
IRENA’s Renewable Power Generation Costs in 2024 puts the global weighted-average LCOE of newly commissioned utility-scale solar PV at $43/MWh.
China achieved approximately $33/MWh, while India averaged around $38/MWh.
Globally, utility-scale solar LCOE has declined about 90 percent from $417/MWh in 2010 to $43/MWh in 2024. Average installed cost fell 87 percent to approximately $691/kW.
India was particularly competitive, with an average installed cost of around $525/kW.
Solar Modules Are Only Part of Project Cost
Cheap solar panels do not automatically produce cheap electricity.
IRENA estimates that balance-of-system costs excluding modules and inverters represented around 65 percent of total utility-scale PV installation costs in 2024.
These expenses include mounting systems, electrical equipment, civil construction, engineering, project development and grid connections.
Another decline in module prices therefore does not necessarily translate into an equivalent reduction in solar PPA prices. Land, labour, financing and grid infrastructure can be equally important.
Why Saudi Arabia Can Deliver Ultra-Low Solar Prices
Saudi Arabia combines strong irradiation with large-scale projects, relatively inexpensive financing and procurement structures that can lower risk.
Higher irradiation allows every MW of solar capacity to generate more electricity annually. Gigawatt-scale developments also create economies of scale across modules, inverters, trackers, construction and transmission.
Financing is equally important because most solar investment occurs before electricity generation begins.
Low-cost debt, government-backed procurement and financially strong electricity buyers reduce risk and therefore the returns lenders and investors require.
Ultra-low solar PPAs are consequently the product of an entire low-cost investment ecosystem, not simply inexpensive solar modules.
China and India Lead on Solar Generation Costs
China’s utility-scale solar PV LCOE was approximately $33/MWh in IRENA’s 2024 dataset, compared with India at $38/MWh and the global average of $43/MWh.
China benefits from the world’s largest photovoltaic manufacturing ecosystem and integrated supply chains spanning polysilicon, wafers, cells and modules.
India combines strong solar resources with relatively low construction costs and a large renewable-energy market.
By comparison, the United States recorded an average utility-scale solar LCOE of approximately $70/MWh.
Capacity Factor Can Transform Solar Revenue
Solar irradiation determines how much electricity installed capacity can generate.
Consider a hypothetical 1 GW solar farm.
At a 20 percent capacity factor, annual generation would be approximately 1.75 million MWh. At 25 percent, output increases to 2.19 million MWh, while a 30 percent capacity factor produces approximately 2.63 million MWh.
At a PPA price of $30/MWh, the 20 percent capacity-factor project generates approximately $52.6 million in gross annual revenue.
At 30 percent, revenue rises to around $78.8 million — a difference of approximately $26.3 million annually.
PPA Price Has a Major Impact on Revenue
The basic equation is:
Annual revenue = electricity sold × PPA price
A 100 MW solar plant operating at a 25 percent capacity factor would produce approximately 219,000 MWh annually.
At $20/MWh, gross revenue would be around $4.38 million. At $30/MWh, it rises to $6.57 million, and at $40/MWh to $8.76 million.
For a 1 GW project generating 2.19 million MWh, every $5/MWh change in PPA price changes annual gross revenue by approximately $10.95 million.
Revenue, however, is not profit. Financing, operating expenses, insurance, taxes, degradation and curtailment must still be deducted.
Financing Can Make or Break Solar Economics
Solar is highly capital intensive, making weighted average cost of capital — WACC — one of the most important factors determining electricity cost.
Two identical 500 MW solar farms using the same equipment could require significantly different PPA prices because their financing costs differ.
Markets with low interest rates, predictable renewable policies and financially secure offtakers can generally access cheaper capital.
Currency exposure can also matter. Developers may purchase equipment or borrow in dollars while receiving PPA revenue in local currency, creating risks if the local currency depreciates.
Offtaker Quality Influences PPA Pricing
A 20-year contract is valuable only if lenders believe the electricity buyer can continue paying.
Government-backed utilities, financially strong electricity companies and investment-grade corporations can reduce revenue risk. Weaker counterparties may require developers to seek higher tariffs, guarantees or other payment protections.
The cheapest PPA can therefore partly reflect credit risk, rather than simply lower solar generation costs.
Europe Shows Why PPA Prices Can Be Higher
European corporate renewable PPA prices reflect land, permitting, grid access, financing and wholesale-market conditions.
LevelTen Energy’s European PPA Price Index tracks offers submitted by renewable developers. Its Q2 2026 European dataset covered 110 PPA price offers from 92 renewable projects across 16 countries.
Government auctions and corporate PPAs should not be compared directly. Auctions may involve standardized contracts and state-backed buyers, while corporate agreements can include customized delivery profiles, certificates, hedging and more complex risk allocation.
Solar-Plus-Storage Changes the Equation
Battery storage is increasingly important.
IRENA reports that utility-scale battery storage project costs declined 93 percent between 2010 and 2024, from approximately $2,571/kWh to $192/kWh.
Standalone solar plants generate primarily during sunny hours, when many competing projects are producing electricity. Batteries can shift part of this production into evening or high-demand periods.
Solar-plus-storage PPAs therefore should not be compared directly with standalone solar contracts based solely on $/MWh because they provide different electricity products.
Grid Charges Can Reverse the Ranking
The PPA tariff is not necessarily the buyer’s final electricity cost.
Consider Project A with a $20/MWh PPA and $15/MWh transmission and delivery cost. Delivered electricity costs $35/MWh.
Project B has a higher $25/MWh PPA, but only $5/MWh in delivery costs, resulting in a cheaper $30/MWh delivered price.
Transmission charges, wheeling fees, grid losses, balancing costs and congestion can therefore reverse the apparent PPA ranking.
Curtailment and Solar Capture Prices Matter
A solar farm earns revenue only from electricity it can deliver and sell.
Transmission congestion can force grid operators to curtail generation, reducing revenue even when the project has excellent irradiation.
Another challenge is solar price cannibalisation. When large amounts of solar electricity enter the grid simultaneously, wholesale prices can collapse during midday and sometimes become negative.
Storage, flexible demand and stronger transmission infrastructure can improve the value of solar generation.
A $30 PPA May Not Stay at $30
Contract escalation also matters.
A PPA beginning at $30/MWh with 2 percent annual escalation would reach approximately $35.85/MWh by year 10 and $44.58/MWh by year 20.
A competing contract with a higher starting price but no escalation could ultimately be cheaper.
Buyers should therefore evaluate the starting tariff, escalation, contract duration, delivery costs and risk allocation rather than comparing first-year PPA prices alone.
Which Country Really Has the Cheapest Solar Electricity?
There is no single winner because different metrics produce different answers.
Saudi Arabia stands out for some of the world’s lowest headline utility-scale solar PPA tariffs, approaching $13/MWh in exceptional projects.
China has very low utility-scale solar generation costs, with LCOE around $33/MWh, while India is highly competitive at approximately $38/MWh, supported by strong solar resources and low construction costs.
But the cheapest PPA, lowest LCOE, lowest delivered electricity cost and highest investor return are four different measurements.
Solar Competition Moves Beyond the Lowest Tariff
Global solar PV capacity reached 2.96 TW after approximately 690 GW was installed in 2025. As the industry approaches unprecedented scale, project economics are becoming more complex.
Solar LCOE has fallen around 90 percent since 2010, while utility-scale battery costs have dropped 93 percent.
The next phase of competition will therefore not be determined simply by another record-low PPA.
For developers, investors and electricity buyers, the strongest solar projects will combine low capex, high irradiation, inexpensive financing, reliable grid access, limited curtailment, creditworthy buyers and sustainable long-term cash flows.
The cheapest solar electricity is ultimately not defined by the lowest number printed on a PPA contract, but by the cost and value of electricity delivered where and when customers actually need it.
SHAFANA FAZAL