
The rapid growth in solar and wind power is creating a challenge for electricity networks worldwide as battery storage, pumped hydro, transmission infrastructure and demand-response systems struggle to keep pace. At COP31 in Antalya, Turkiye, the critical issue is no longer simply how much renewable capacity countries can install, but how much clean electricity their grids can absorb, store and deliver profitably.
The International Energy Agency’s Renewables 2026 report forecasts more than 4,770 GW of additional renewable power capacity worldwide between 2026 and 2031, with solar photovoltaic systems accounting for approximately three-quarters of the expansion.
However, the IEA’s latest analysis reveals that global grid connection queues have expanded from approximately 3,500 GW to nearly 4,400 GW in 2026, including renewable generation, battery storage and hybrid projects.
Battery storage applications alone exceed 1,500 GW, an increase of approximately 900 GW in one year, while hybrid project applications have reached 600 GW. These figures represent proposed projects awaiting grid access, not installed capacity.
Global Battery Storage Deployment Reaches 108 GW in 2025
The IEA Global Energy Review 2026 reports that worldwide battery storage additions reached 108 GW in 2025, increasing 40 percent from 2024.
Approximately 80 percent of new battery installations were utility-scale projects, while the remainder were residential and commercial systems.
China accounted for nearly 60 percent of global installations, followed by the United States and Europe. Lithium iron phosphate batteries represented approximately 90 percent of deployments.
The IEA notes that battery duration is increasing, although most installations remain concentrated around two hours. Four-hour systems are gaining importance as solar penetration increases.
A 1 GW battery operating for two hours provides 2 GWh of energy storage, compared with 4 GWh for a four-hour installation. Consequently, GW installation statistics alone cannot establish how much surplus solar electricity can be shifted into evening demand.
China: 63 GW of Batteries Added, but Renewable Curtailment Persists
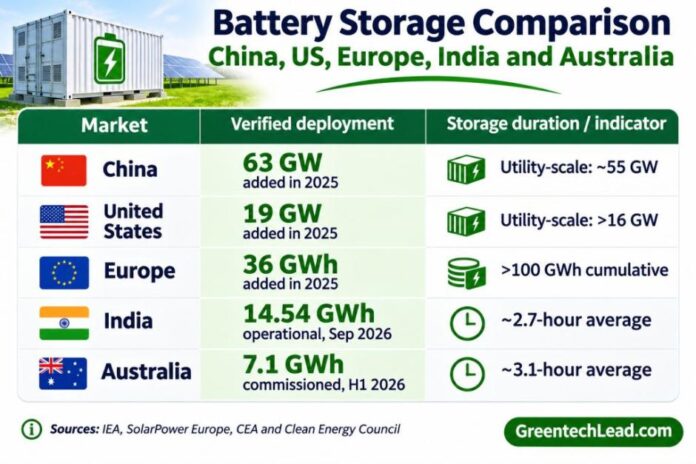
China installed more than 63 GW of battery storage in 2025, including approximately 55 GW of utility-scale systems and 8 GW of behind-the-meter installations, according to the IEA’s battery storage analysis.
China also installed approximately 430 GW of wind and solar generation capacity during 2025, taking its combined wind and solar fleet to around 1,840 GW.
Despite these additions, renewable curtailment increased during the first quarter of 2026. The Climate Action Tracker’s China assessment identifies higher wind and solar curtailment as a factor contributing to increased coal consumption and emissions during that quarter.
The challenge is geographic as well as technological: large renewable projects are concentrated in regions distant from major electricity-consuming centers, requiring additional transmission, storage and flexible demand.
United States: 19 GW Battery Expansion Faces Grid Connection Delays
The United States added approximately 19 GW of battery capacity in 2025, increasing nearly 60 percent year over year.
Utility-scale batteries accounted for more than 16 GW, while residential and commercial installations contributed nearly 3 GW.
However, grid connection delays remain a significant constraint. The IEA’s 2026 assessment identifies approximately 160 GW of early-stage standalone solar projects that exited US connection queues during recent reforms. These withdrawals are not equivalent to commissioned or permanently rejected capacity.
Battery developers depend on wholesale electricity price spreads, ancillary service payments and capacity contracts to recover investment. Increasing competition can reduce returns from frequency regulation and energy arbitrage, particularly in markets where battery installations expand faster than revenue opportunities.
Europe: 36 GWh Added as Solar-to-Battery Ratio Remains 8:1
According to SolarPower Europe’s European Battery Market Outlook 2026–2030, Europe installed 36 GWh of battery storage in 2025, an increase of 48 percent.
Cumulative operating battery capacity exceeded 100 GWh, with utility-scale projects accounting for more than half of annual additions.
The European Union installed 27 GWh during 2025, taking cumulative capacity to nearly 80 GWh.
However, the EU’s solar PV-to-battery ratio remained approximately 8:1 at the end of 2025, improving from 10:1 in 2024 but indicating that storage expansion continues to lag solar deployment.
SolarPower Europe expects annual European battery installations to exceed 50 GWh in 2026 and reach 138 GWh by 2030 under its medium scenario.
Germany, the UK and Italy remain important markets, while Ukraine and Bulgaria each added approximately 3 GWh in 2025.
India: 14.54 GWh Operational, but 79 GWh Remains Under Construction
India’s Central Electricity Authority battery storage status report dated September 30, 2026 identifies 19 operational battery projects with 5,317.85 MW of power capacity and 14,543.2 MWh of energy capacity.
Another 63 projects, representing 27.73 GW and 78.96 GWh, are under construction. An additional 28 projects totaling 28.91 GWh have been awarded, while 76.02 GWh remains in the tender stage.
The operational fleet has an average rated duration of approximately 2.7 hours.
India also had approximately 6 GW of operational pumped storage as of June 2026, according to Mercom India’s energy storage research.
The difference between operational capacity and the development pipeline highlights the importance of execution, grid connections and storage procurement.
Australia: 7.1 GWh Commissioned in Just Six Months
Australia provides one of the strongest examples of storage investment progressing into operational projects.
The Clean Energy Council’s first-half 2026 investment report shows that nine large battery projects, representing $4.3 billion in investment, entered operation during the first six months of 2026.
These projects added 2.3 GW and 7.1 GWh of storage, exceeding the 2 GW and 5.1 GWh commissioned during all of 2025.
The country also had 141 renewable generation and storage projects worth approximately $32.5 billion at financial close or under construction.
Wholesale electricity prices averaged $74/MWh in the June quarter, down 47 percent year over year, although that decline cannot be attributed solely to batteries.
Battery Storage Costs Fall 27%, but Investment Returns Depend on Electricity Markets
The BloombergNEF Levelized Cost of Electricity 2026 analysis estimates that the global benchmark levelized cost of a four-hour battery project declined 27 percent in 2025 to $78/MWh.
The figure represents the levelized cost of storage, not the upfront project cost per kWh.
BloombergNEF also estimates that 87 GW of combined solar and storage projects were added during 2025, delivering electricity at an average cost of $57/MWh.
Lower equipment costs improve project economics, but profitability depends on the difference between charging and discharge prices, battery utilization, degradation, financing costs and payments for grid services.
A project can have attractive technology costs but weak investment returns if daytime electricity prices fall sharply or grid connection delays postpone commercial operation.
Pumped Hydro, Demand Response and Grid Flexibility Remain Essential
Batteries cannot independently solve every renewable integration problem. Two- to four-hour systems can shift solar generation into evening demand, but longer periods of low wind or solar production may require pumped hydro, long-duration storage, flexible generation and demand response.
The IEA identifies grid expansion, faster connection approvals and demand-side flexibility as essential measures for reducing renewable curtailment.
Its analysis suggests that improved network utilization and grid-enhancing technologies can unlock substantial additional renewable capacity without waiting for every new transmission project to be completed.
COP31: Commissioned Storage Matters More Than Announced Capacity
The investment evidence reveals different stages of market development. China and the United States dominate battery installations measured in GW. Europe is expanding utility-scale storage but still faces a large solar-to-battery gap. India has a substantial project pipeline awaiting commissioning, while Australia is demonstrating rapid conversion of storage investment into operational GWh.
Solar curtailment is an established concern in China and relevant to high-solar electricity markets, but comparable 2026 curtailed-energy percentages across all five markets are not available from the reviewed sources.
The central challenge for COP31 is ensuring that renewable generation, electricity storage and transmission capacity expand together. Governments and utilities need to measure not only solar installations and battery project announcements, but also operational storage duration, grid connection completion, curtailed electricity and realized project revenues.
Without those improvements, additional renewable generation could produce electricity at times and locations where the power system cannot use it efficiently.
BABURAJAN KIZHAKEDATH
