

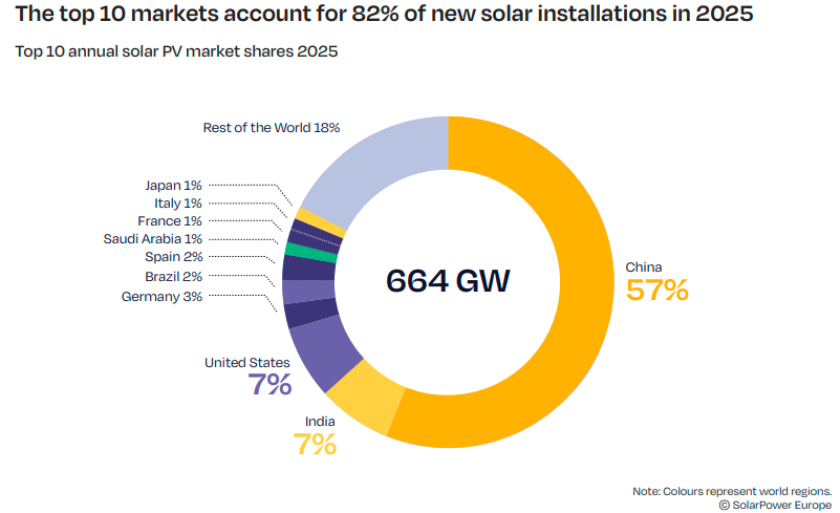
The global solar photovoltaic (PV) industry achieved a historic milestone in 2025, adding a record 664 GW of new installed capacity worldwide.
The solar market expanded by 69 GW compared with 2024 and by an impressive 212 GW compared with 2023. However, while solar deployment continues to break records, growth rates are moderating, slowing from 85 percent in 2023 to 32 percent in 2024 and further to 12 percent in 2025, SolarPower Europe report indicated.
Despite the deceleration, solar PV remained the dominant force behind the global energy transition. Solar accounted for 77 percent of all renewable energy capacity additions in 2025 and generated 2,778 TWh of electricity globally. Solar’s contribution to worldwide electricity production reached 9 percent, doubling in just four years and surpassing wind power for the first time.
Asia-Pacific Leads Global Solar Expansion
The Asia-Pacific region continued to dominate global solar growth, contributing 487 GW of new capacity in 2025, representing 73 percent of worldwide installations. Regional growth reached 17 percent, significantly above the global average of 12 percent.
Europe remained the second-largest regional market, installing 81.6 GW and recording modest growth of 3 percent. The Americas ranked third with 43.2 GW of new capacity and accounted for 12 percent of global additions. However, the region was the only major market to experience a decline, with installations falling by 13 percent year-on-year.
The Middle East and Africa added 23.7 GW of solar capacity, making it the smallest regional market but also the fastest-growing, with installations surging 51 percent compared with 2024.
By the end of 2025, global operating solar PV capacity reached 2.9 TW, doubling in just three years and tripling within four years, underscoring the unprecedented pace of deployment.
China Dominates Global Solar Rankings
The global solar market remained highly concentrated in 2025, with the top 10 countries accounting for 82 percent of all new solar installations, up from 81 percent in 2024.
China strengthened its dominance by installing a record 382 GW of solar capacity, representing 57 percent of all global additions. For the third consecutive year, China alone deployed more solar capacity than all other top 10 markets combined.
India emerged as the second-largest solar market worldwide after adding 45.7 GW and achieving annual growth of 49 percent. This allowed India to overtake the United States and reinforce its position as the fastest-growing major solar market outside China.
The United States ranked third despite a 14 percent decline in installations to 43.2 GW. Germany climbed to fourth place with 17.4 GW, surpassing Brazil, whose installations declined to 14.5 GW. Spain maintained sixth place with 11.3 GW of new solar capacity.
Saudi Arabia became one of the standout performers of 2025, tripling annual installations to 8.4 GW and securing seventh position globally. It was the only country from the Middle East and Africa region to feature among the world’s top 10 solar markets.
The minimum threshold required to enter the global top 10 increased from 4.7 GW in 2024 to 5.8 GW in 2025, highlighting the broadening adoption of solar energy across global markets.
As a combined market, the European Union would rank second globally, installing 67.2 GW in 2025 and accounting for 10 percent of worldwide solar demand.
Global Solar Market Forecast to Decline in 2026
After years of uninterrupted expansion and a record 664 GW added in 2025, the global solar industry is expected to experience its first annual contraction in more than 20 years during 2026.
Under the Medium Scenario, global solar installations are projected to decline by 8 percent to 612 GW. The primary factor behind this slowdown is a forecast 24 percent contraction in China’s solar market. Additional challenges include rising curtailment rates, increasing occurrences of negative electricity prices in mature markets, and growing pressure on grid infrastructure, energy storage systems, and overall system flexibility.
Nevertheless, solar PV remains among the most cost-competitive and rapidly deployable energy technologies. Geopolitical tensions, particularly in the Middle East, are also increasing concerns over fossil fuel supply security and energy prices, strengthening solar’s strategic role in national energy policies.
The Low Scenario projects global installations falling to 501 GW, representing a 25 percent contraction. In contrast, the High Scenario forecasts continued growth of 9 percent, pushing annual installations to 724 GW, driven largely by stronger deployment outside China.
Despite short-term uncertainty, all scenarios suggest that 2026 represents a temporary market adjustment rather than a structural decline. Under the Medium Scenario, annual installations are expected to recover and reach 864 GW by 2030, implying a compound annual growth rate (CAGR) of 7 percent over the next five years.
China Drives 2026 Market Correction
China is expected to be the principal driver of the anticipated global slowdown. Under the Medium Scenario, Chinese solar installations are forecast to decline by 93 GW in 2026 compared with 2025 levels, reducing global installations by approximately 53 GW.
This decline is expected to outweigh roughly 40 GW of additional solar growth across the rest of the world, illustrating China’s overwhelming influence on global solar trends.
The market correction follows a major policy change implemented on June 1, 2025, when China ended its fixed feed-in tariff regime. New solar projects are now required to sell electricity directly into power markets rather than receiving guaranteed tariff payments. Developers accelerated project installations before the deadline, resulting in exceptionally strong deployment during early 2025 and a subsequent slowdown during the second half of the year and into 2026.
Outside China, solar deployment is expected to continue growing across all major regions. Asia-Pacific excluding China is forecast to expand by 18 percent, supported by India and emerging markets. Europe is projected to grow by approximately 3 percent, while the Americas are expected to increase installations by 11 percent. The Middle East and Africa will lead regional growth with a projected 48 percent surge in installations.
As China’s market contracts, every other region is expected to gain global market share during 2026.
Global Solar Capacity to Reach 6.6 TW by 2030
After surpassing the 2 TW milestone in 2024 and reaching approximately 2.9 TW by the end of 2025, global solar capacity exceeded 3 TW in early 2026. The achievement highlights the extraordinary acceleration of solar deployment, considering that the industry required nearly seven decades to install its first terawatt but less than four years to triple that capacity.
Looking ahead, the global solar fleet is projected to more than double again, reaching 6.6 TW by 2030 under the Medium Scenario. While this forecast remains robust, it is lower than last year’s projection of 7.1 TW, reflecting growing system constraints and a more cautious short-term outlook.
In support of the COP28 objective to triple renewable energy capacity to 11 TW by 2030, solar PV is expected to contribute approximately 60 percent of the target. This reinforces solar’s unmatched scalability, cost competitiveness, deployment speed, and growing importance for energy security and decarbonization strategies worldwide.
Although the industry faces temporary challenges in 2026, the long-term outlook remains highly positive. Solar PV continues to expand at an unprecedented pace, cementing its position as the cornerstone technology for global decarbonization and energy security.
BABURAJAN KIZHAKEDATH