Indian businesses are investing in solar energy to reduce electricity expenses, improve profitability and meet sustainability targets. However, choosing between rooftop solar and open access solar can significantly affect investment requirements, electricity savings and long-term financial returns.
Investment in rooftop solar allows factories, warehouses, hospitals, hotels and commercial buildings to generate electricity at their premises. Open access solar enables eligible businesses to purchase renewable electricity from off-site solar projects through the electricity grid.
For businesses evaluating solar investments in 2026, the key considerations are capital expenditure (CAPEX), landed electricity cost, payback period, roof availability, consumption patterns and state regulations.
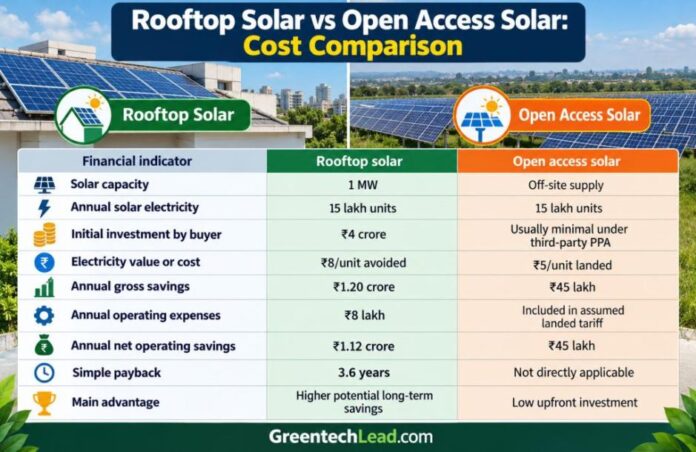
The above chart shows comparison that uses illustrative assumptions for a business consuming 1.5 million units of electricity annually. This is for illustrative financial comparison, not prevailing market quotations. Rooftop figures assume 100% self-consumption and exclude financing, taxes and replacement costs.
The central difference is that rooftop ownership can generate higher operating savings but requires significant capital. Third-party open access procurement generally preserves capital while providing electricity at a negotiated tariff.
1. Rooftop Solar: Investment and Payback for a 1 MW Factory
Consider a manufacturing company installing a 1 MW rooftop solar plant for ₹4 crore.
Assuming annual generation of 15 lakh units and an avoidable grid electricity charge of ₹8 per unit:
Annual electricity savings: ₹1.20 crore
Annual maintenance expenditure: ₹8 lakh
Net annual operating savings: ₹1.12 crore
Simple investment payback: approximately 3.6 years
Over 20 years, these annual savings could total ₹22.4 crore before accounting for degradation, financing, taxes, equipment replacement and changes in electricity tariffs.
For example, an automobile components factory operating primarily during daylight hours may consume most of its rooftop generation immediately, improving returns.
However, a warehouse operating mainly at night may achieve lower savings unless it can export surplus electricity at attractive rates or economically integrate battery storage.
Rooftop solar offers the strongest economics when daytime electricity consumption closely matches solar generation.
2. Open Access Solar: How Businesses Can Reduce Electricity Bills
Open access solar allows businesses to procure renewable electricity without constructing a solar plant on their premises.
Consider a company purchasing 15 lakh units annually through a solar power purchase agreement (PPA).
| Cost component | Illustrative rate |
| Solar generation tariff | ₹3.50/unit |
| Wheeling, transmission and other applicable charges | ₹1.50/unit |
| Total landed electricity cost | ₹5.00/unit |
| Avoidable grid electricity charge | ₹8.00/unit |
| Savings per unit | ₹3.00 |
| Annual savings | ₹45 lakh |
The ₹45 lakh saving represents a 37.5 percent reduction in the compared energy cost.
For example, a large textile manufacturer with insufficient roof space could procure electricity from a solar project located elsewhere in the state.
However, open access economics depend heavily on state-specific charges, banking provisions, losses and contract conditions.
The CEEW Open Access Calculator provides a useful starting point for assessing procurement economics.
3. Rooftop Solar Returns Depend on Self-Consumption
Businesses should not assume that every unit generated by rooftop solar saves the full retail electricity tariff.
Consider the same 1 MW installation generating 15 lakh units annually, but with only 60 percent consumed on-site.
| Financial measure | Annual value |
| Self-consumed electricity | 9 lakh units |
| Savings at ₹8/unit | ₹72 lakh |
| Exported electricity | 6 lakh units |
| Export revenue at assumed ₹2/unit | ₹12 lakh |
| Total electricity value | ₹84 lakh |
| Maintenance expenditure | ₹8 lakh |
| Net operating savings | ₹76 lakh |
| Simple payback | 5.3 years |
The payback period increases from 3.6 years to approximately 5.3 years because surplus generation receives a lower assumed tariff.
Factories with continuous daytime production, cold-storage facilities and commercial campuses may achieve better self-consumption than businesses operating mainly after sunset.
4. Open Access Solar: Group Captive vs Third-Party PPA
Indian businesses generally evaluate two important open access procurement structures.
Third-party PPA: A solar developer owns the generating asset and sells electricity to the business under a contractual tariff. The buyer generally avoids investing directly in the plant.
Group captive solar: Multiple commercial or industrial consumers invest in a generating project and purchase its electricity.
Under the general captive framework, captive users must collectively maintain at least 26 percent ownership and consume at least 51 percent of annual generation, subject to applicable rules and verification.
Group captive arrangements can offer advantages regarding certain electricity surcharges, but they introduce equity investment, compliance and ownership risks.
Businesses should examine the Ministry of Power’s 2026 captive electricity amendments before selecting a procurement structure.
5. Which Industries Benefit Most?
| Industry | Preferred option to evaluate | Key reason |
| Automobile manufacturing | Rooftop + open access | Large daytime consumption |
| Textile manufacturing | Open access or hybrid | High electricity requirements |
| Warehousing | Rooftop solar | Large roof availability |
| Data centres | Open access + rooftop | Continuous electricity demand |
| Hospitals | Rooftop + grid supply | Daytime and night-time loads |
| Hotels | Rooftop or hybrid | Mixed consumption patterns |
| IT campuses | Rooftop + open access | Daytime loads and renewable targets |
These are screening recommendations, not universal rankings. The preferred model depends on site conditions, electricity demand and applicable state regulations.
For example, a data centre with substantial round-the-clock consumption may benefit from open access solar procurement, but solar alone cannot guarantee 24-hour renewable electricity.
6. Hybrid Solar: Example of ₹1.72 Crore Annual Savings
A manufacturing company consuming 50 lakh electricity units annually could combine rooftop generation, open access procurement and conventional grid electricity.
Illustrative annual electricity mix
Rooftop 30%
Open access 40%
Grid 30%
Under the illustrative assumptions:
Rooftop generation: 15 lakh units
Open access procurement: 20 lakh units at ₹5/unit
Remaining grid supply: 15 lakh units at ₹8/unit
Rooftop operating expenses: ₹8 lakh annually
Compared with purchasing all 50 lakh units from the grid at ₹8, the hybrid strategy produces ₹1.72 crore in annual operating savings, before rooftop capital recovery, financing, taxes and excluded costs.
This example assumes all rooftop generation is self-consumed and all contracted open access electricity is delivered and used.
7. State Regulations Can Change Solar Economics
Electricity regulation is a critical consideration because open access charges, banking provisions, settlement arrangements and export compensation vary across Indian states.
The national Green Energy Open Access Rules establish a general 100 kW eligibility threshold, subject to applicable conditions.
Businesses operating in Maharashtra, Gujarat, Karnataka, Tamil Nadu, Telangana or Kerala should calculate their actual landed electricity costs using the latest state electricity regulatory commission orders.
Time-of-day tariffs also matter. Solar generation may offset daytime energy purchases but may not eliminate fixed charges or peak-demand charges. The government’s Time-of-Day Electricity Tariff Framework explains the national policy approach.
8. Key Risks Businesses Must Evaluate
Rooftop solar projects face generation degradation, roof maintenance, inverter replacement, financing costs and potential restrictions on electricity exports.
Open access procurement introduces exposure to regulatory charges, banking restrictions, grid losses, curtailment, contract escalation and developer performance.
A 15 percent decline in rooftop generation would extend the illustrative 1 MW project’s simple payback to approximately 4.3 years, assuming all remaining generation offsets grid purchases.
Similarly, an increase in the open access landed tariff from ₹5 to ₹5.75 per unit would reduce annual savings from ₹45 lakh to ₹33.75 lakh.
Businesses should compare 20–25-year cash flows using net present value (NPV), internal rate of return (IRR) and downside scenarios rather than relying exclusively on simple payback.
Final Verdict: Rooftop Solar or Open Access Solar?
Rooftop solar is generally the stronger option for businesses with suitable roof space, high daytime electricity consumption and access to affordable capital. It can deliver attractive long-term returns once the initial investment is recovered.
Open access solar is particularly attractive for electricity-intensive businesses with limited roof space or capital constraints. Its financial advantage depends on the landed tariff, contract structure and state regulations.
For larger manufacturing facilities, commercial campuses and multi-location businesses, a hybrid strategy may provide a more effective balance between electricity savings, investment requirements and procurement flexibility.
The best decision in 2026 is not necessarily the option offering the lowest advertised solar tariff. It is the model delivering the highest risk-adjusted lifetime savings after accounting for capital expenditure, electricity charges, financing and regulatory compliance.
SHAFANA FAZAL