
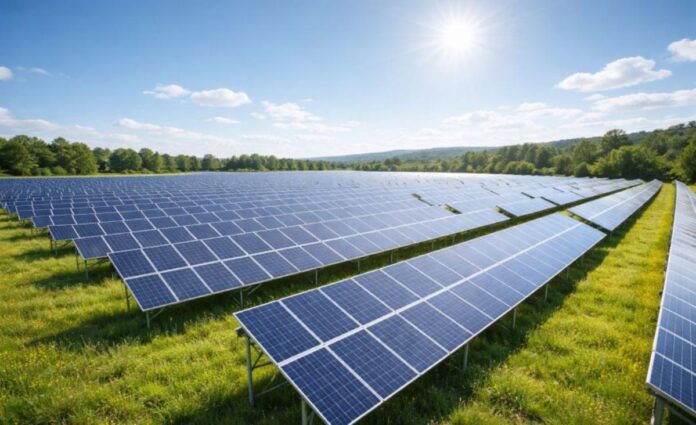
Open access solar is emerging as a major electricity cost-saving opportunity for Indian manufacturers, data centres, textile companies, commercial buildings and other energy-intensive businesses. By purchasing solar electricity from off-site power projects, eligible companies can reduce dependence on distribution companies (DISCOMs) and potentially lower their electricity expenditure.
However, the financial attractiveness of open access solar depends on more than the solar power purchase agreement (PPA) tariff. Cross-subsidy surcharge, additional surcharge, transmission charges, wheeling fees, banking provisions and electricity losses can significantly increase the final electricity cost.
For businesses evaluating open access solar in 2026, the most important financial indicator is landed electricity cost per usable unit, rather than the quoted solar generation tariff.
What Is Open Access Solar and Who Can Use It?
Open access solar allows eligible businesses to purchase electricity from independent solar power producers through existing transmission and distribution networks.
Under India’s Green Energy Open Access Rules, the general eligibility threshold is 100 kW of contracted demand or sanctioned load, subject to applicable provisions and exceptions.
Businesses can procure solar electricity through three principal arrangements:
Third-party PPA: Purchase electricity from an independent solar developer without owning the generating plant.
Captive solar: Invest in a generating facility primarily serving the business’s electricity requirements.
Group captive solar: Participate in a jointly owned generation project with other eligible electricity consumers.
Third-party procurement generally requires less upfront capital. Captive and group-captive arrangements can offer surcharge exemptions when statutory conditions are satisfied.
Open Access Solar Charges in India 2026
Businesses must calculate all applicable charges before comparing solar procurement with existing DISCOM tariffs.
| Charge | Financial impact |
| Solar PPA tariff | Electricity purchase price paid to the developer |
| Transmission charges | Cost of using transmission infrastructure |
| Wheeling charges | Cost of using distribution networks |
| Cross-subsidy surcharge (CSS) | Applicable to certain non-captive open access purchases |
| Additional surcharge (AS) | May apply to eligible consumer categories |
| Banking charges | Cost of permitted energy banking arrangements |
| Transmission and distribution losses | Reduce usable electricity |
| Scheduling and system operation charges | Increase procurement expenses |
These charges differ by state, voltage level, consumer category and procurement structure. Not every charge applies to every project.
Example: How a ₹3.50 Solar Tariff Becomes ₹5.56
Consider a manufacturing company signing an open access solar PPA at ₹3.50 per kWh.
Assume applicable charges total ₹1.50 per injected unit.
The combined cost becomes ₹5 per injected unit. If network losses and settlement adjustments reduce usable electricity to 90 percent, the effective landed cost increases to approximately ₹5.56 per usable unit.
Against an avoidable grid electricity charge of ₹9 per unit, the business saves approximately ₹3.44 per usable unit.
This represents a potential reduction of about 38 percent in the compared electricity energy cost, excluding other expenses.
The example demonstrates why comparing ₹3.50 solar electricity directly with a ₹9 DISCOM tariff can substantially overstate actual savings.
State-Wise Open Access Solar Comparison: Gujarat, Maharashtra, Karnataka, Tamil Nadu and Rajasthan
State electricity regulations play a decisive role in project profitability.
| State | Business opportunity | Important cost consideration |
| Gujarat | Industrial manufacturing and large commercial consumers | Additional surcharge, CSS and network charges |
| Maharashtra | Automotive, chemicals, pharmaceuticals and data centres | DISCOM-specific tariffs and applicable surcharges |
| Karnataka | IT campuses, manufacturing and commercial facilities | Banking, wheeling and settlement rules |
| Tamil Nadu | Textile, automobile and engineering industries | Transmission charges, banking and grid connectivity |
| Rajasthan | Large solar projects and industrial electricity procurement | Transmission access, losses and delivered electricity cost |
| Haryana | Manufacturing, logistics and industrial parks | Demand category, surcharge and connectivity |
| Uttar Pradesh | Large industrial facilities and commercial consumers | Applicable tariffs, voltage and network charges |
No state can reliably be declared the cheapest without calculating current landed costs under identical project assumptions.
For example, a solar project in Rajasthan may offer competitive generation costs, but transmission expenses can affect electricity delivered to an industrial consumer elsewhere.
Similarly, a manufacturing company in Gujarat may benefit from an attractive PPA tariff while facing additional regulatory charges.
The Gujarat Electricity Regulatory Commission issued an additional surcharge order dated September 10, 2026, covering the period from October 1, 2026, to March 31, 2027. Businesses should verify the applicable rate and eligibility before calculating savings.
The CEEW Open Access Calculator can support preliminary financial comparisons, although current regulatory orders should determine final investment assumptions.
Captive and Group Captive Solar Rules in 2026
Captive solar procurement can improve electricity economics because qualifying captive consumption may be exempt from CSS and AS.
Under the general captive framework, users must collectively maintain at least 26 percent ownership and consume at least 51 percent of annual electricity generation, subject to applicable ownership and consumption requirements.
India’s Electricity (Amendment) Rules, 2026 clarified captive ownership, proportionate consumption, verification and related surcharge treatment.
The amended framework provides for non-levy of CSS and AS pending verification when prescribed declarations and conditions are satisfied.
However, businesses that fail the captive eligibility tests may become liable for applicable surcharges and carrying costs.
For example, a group of textile manufacturers investing in a shared solar project must monitor ownership, annual generation and electricity consumption. Changes in participating companies or their electricity requirements can affect compliance.
Group captive solar can offer attractive savings, but ownership and consumption compliance must be maintained throughout the project.
How Much Can Indian Businesses Save With Open Access Solar?
The following examples assume that landed solar electricity costs are lower than avoidable DISCOM electricity charges.
| Annual usable solar electricity | Savings per unit | Annual savings |
| 5 lakh units | ₹3.00 | ₹15 lakh |
| 20 lakh units | ₹3.00 | ₹60 lakh |
| 30 lakh units | ₹3.50 | ₹1.05 crore |
| 1 crore units | ₹3.50 | ₹3.50 crore |
These are illustrative gross energy-cost savings, not guaranteed net profits. Actual savings depend on electricity delivery, consumption, charges and contract conditions.
Example: 1 MW Captive Solar Project Payback
Consider a business investing ₹4 crore in a 1 MW captive solar project.
Assume annual usable electricity of 15 lakh units, an avoidable grid electricity cost of ₹9 per unit and an effective solar electricity cost of ₹5 per unit.
The electricity cost difference is ₹4 per unit, generating an annual benefit of ₹60 lakh.
After an assumed ₹5 lakh in additional annual operating expenditure, the benefit becomes ₹55 lakh, implying simple payback of approximately 7.3 years.
This is a simplified illustration. If the ₹5 solar cost already includes project capital recovery or operating expenses, deducting those costs again would double-count expenditure. An actual captive investment model must separate operating costs, network charges and capital recovery.
Financing, taxes, degradation and replacement expenses must also be included when calculating project IRR.
Which Businesses Benefit Most From Open Access Solar?
Open access procurement is particularly relevant to electricity-intensive industries with predictable consumption.
Textile manufacturers: Spinning, weaving and processing facilities can use substantial electricity volumes, creating opportunities for long-term procurement savings.
Automobile manufacturers: Large production facilities may combine rooftop solar with off-site renewable electricity to meet daytime and extended-shift requirements.
Data centres: Open access can support renewable electricity procurement, although solar generation alone cannot meet continuous 24-hour demand.
Pharmaceutical and chemical companies: Facilities with substantial electricity consumption may benefit from negotiated long-term tariffs.
IT campuses and commercial complexes: Businesses with limited rooftop capacity can evaluate off-site solar procurement, subject to eligibility and connection arrangements.
For all these consumers, hourly electricity demand is important. Solar production concentrated during daylight hours may not match evening or night-time consumption.
Key Risks Before Signing an Open Access Solar PPA
Businesses should evaluate regulatory changes, generation shortfalls, curtailment, banking restrictions and transmission availability.
For example, if a company expects 20 lakh usable solar units annually but receives only 17 lakh, savings at ₹3 per unit fall from ₹60 lakh to ₹51 lakh.
Similarly, an increase in the effective landed tariff from ₹5 to ₹6 per unit reduces savings by ₹20 lakh annually on 20 lakh usable units.
PPA negotiations should therefore address tariff escalation, minimum electricity delivery, change-in-law provisions, payment security, termination rights and responsibility for network-related costs.
Businesses should also compare 15–25-year cash flows using net present value, internal rate of return and realistic downside scenarios.
Final Verdict: Is Open Access Solar Profitable in India in 2026?
Open access solar can deliver meaningful electricity savings for Indian businesses, particularly those consuming large volumes of electricity and seeking alternatives to conventional DISCOM supply.
Third-party PPAs can suit companies seeking lower upfront investment, while captive and group-captive projects may offer stronger economics when ownership and consumption requirements are satisfied.
However, a low solar PPA tariff does not automatically mean low electricity costs. State-specific surcharges, network charges, losses, banking rules and actual electricity consumption ultimately determine financial returns.
Businesses should compare the complete landed cost of solar electricity against avoidable grid charges, verify current regulations and assess long-term contract risks before investing.
The most profitable open access solar arrangement is the one delivering dependable electricity savings after accounting for all charges, capital commitments and regulatory obligations.
SHAFANA FAZAL
