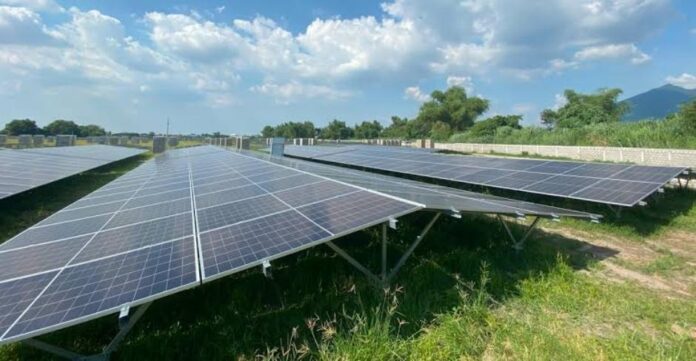
China and India remain among the world’s cheapest major markets for utility-scale solar power, with recent comparable LCOE benchmarks of about $33/MWh and $38/MWh respectively. But falling module prices are changing the economics of solar: financing, capacity factor, grid access, storage and balance-of-system costs increasingly determine which countries can deliver the cheapest usable electricity.
Solar power remains one of the world’s most competitive sources of new electricity. The International Renewable Energy Agency (IRENA) reports that the global weighted-average levelized cost of electricity (LCOE) from utility-scale solar PV was approximately $44/MWh in 2025, unchanged from 2024 after years of steep declines. More than 90 percent of utility-scale renewable projects commissioned in 2025 produced electricity below the cost of the cheapest new fossil-fuel alternative in their respective markets.
The country comparison, however, reveals significant differences. The latest globally comparable country-level figures put China at approximately $33/MWh and India at $38/MWh, compared with a global benchmark of about $43/MWh in 2024.
These figures make China and India two of the most important markets for understanding how solar power became so cheap.
China Has the Lowest Solar LCOE Among Major Markets
China currently sets the cost benchmark for large-scale solar.
IRENA’s country-level data put China’s weighted-average utility-scale solar LCOE at approximately $0.033/kWh, or $33/MWh, in 2024. The global average was $43/MWh.
China’s advantage is not simply sunshine.
Its enormous vertically integrated photovoltaic manufacturing ecosystem covers polysilicon, wafers, cells, modules, solar glass, inverters and other components. Domestic project developers can procure equipment at huge scale while an enormous annual installation market gives manufacturers consistent demand.
China also benefits from standardization and accumulated construction experience.
Large developers and EPC companies repeatedly deploy similar technologies across gigawatt-scale portfolios, increasing construction productivity and reducing procurement costs.
IRENA data show how dramatically the economics have changed: global utility-scale PV installed costs declined approximately 87 percent between 2010 and 2024, while LCOE dropped about 90 percent.
The next phase of Chinese cost leadership is increasingly about system economics rather than panels alone.
IRENA’s analysis of 24/7 renewable electricity says China currently establishes the global cost floor for firm renewable power, while Brazil, India, South Africa, Australia and the Gulf are moving rapidly toward competitive costs for solar and wind combined with storage.
India Combines $38/MWh Solar With Low Project CAPEX
India provides perhaps the strongest alternative low-cost model.
IRENA’s comparable data put India’s utility-scale solar LCOE at approximately $38/MWh in 2024, the second-lowest among the major markets analyzed. That represented a 10 percent year-on-year decline and a 91 percent reduction since 2010.
India also recorded a weighted-average installed cost of approximately $525/kW, compared with about $591/kW in China.
At $525/kW, a theoretical 1 GW utility-scale solar project would correspond to approximately $525 million of installed investment. At China’s $591/kW benchmark, the equivalent would be about $591 million.
These are benchmark calculations rather than current quotations for individual projects. Land, transmission, taxes, equipment specifications, labor and financing can materially alter actual investment.
India’s advantage comes from a combination of strong irradiation, huge solar parks, competitive auctions, relatively low construction costs and rapidly expanding domestic manufacturing.
The scale is visible at Khavda in Gujarat. Adani Green Energy’s renewable-energy complex covers approximately 538 square kilometres and targets 30 GW of capacity by 2029. By March 31, 2026, operational capacity had reached 9.4 GW, following the commissioning of 5.1 GW during FY2025-26.
Gigawatt-scale developments can spread the cost of roads, substations, transmission and project infrastructure over much larger generation portfolios.
Cheap Solar Panels Do Not Automatically Mean Cheap Electricity
One of the most important distinctions for investors is between module price, project CAPEX, LCOE and PPA tariff.
Module price measures the cost of panels, usually in dollars per watt. CAPEX represents the complete cost of constructing the plant. LCOE estimates the lifetime cost of producing electricity. A PPA or auction tariff is the price at which a developer agrees to sell power.
They are not interchangeable.
Chinese TOPCon module prices in September 2026 were around RMB0.70/W for mainstream 182 mm products, with leading manufacturer quotations around RMB0.70-RMB0.72/W.
At an approximate $0.10/W, modules for 1 GW would have a nominal value around $100 million.
But a 1 GW solar plant costs far more than $100 million.
Developers must also pay for trackers or mounting systems, inverters, transformers, cables, civil works, engineering, substations, roads, land, grid connections and financing.
As modules become cheaper, these non-module expenses represent a larger proportion of total project economics.
IRENA reported that balance-of-system expenses excluding modules and inverters already represented around 65 percent of utility-scale PV installed costs in 2024.
Capacity Factor Can Change the Solar Cost Equation
Solar economics ultimately depend on how much electricity an asset generates from the capital invested.
Consider a 1 GW solar plant.
At a 20 percent capacity factor, it produces about 1.75 TWh annually. Increase the capacity factor to 25 percent and generation rises to approximately 2.19 TWh.
At 30 percent, output reaches roughly 2.63 TWh, while 33 percent delivers nearly 2.89 TWh annually.
This explains why markets with exceptional irradiation can compete despite having higher equipment or construction costs.
Trackers, bifacial modules and efficient plant designs can also improve yield.
A more expensive project can therefore deliver cheaper electricity over its lifetime if its additional CAPEX produces significantly more megawatt-hours.
Financing Is a Hidden Reason Solar Costs Differ by Country
Financing can be just as important as equipment.
Solar projects require most of their capital before electricity production begins. Interest rates, debt availability, repayment periods, equity-return requirements and country risk therefore directly affect LCOE.
Two technically identical solar farms can have very different generation costs if one has access to low-cost, long-tenor project financing while the other faces expensive capital.
A long-term PPA with a strong electricity buyer can reduce risk and improve financing terms.
This is one reason countries with excellent solar resources do not automatically appear at the top of global low-cost rankings. High financing costs can offset cheap land, labor and abundant sunshine.
For emerging solar markets in Africa and elsewhere, reducing the cost of capital may consequently deliver larger benefits than squeezing another few cents from module prices.
Saudi Arabia Shows the Power of Scale and Project Finance
Saudi Arabia provides another increasingly important model.
ACWA Power, Badeel and Saudi Aramco Power Company have reached financial close on seven renewable projects totaling 15 GW, representing approximately $8.2 billion of investment.
Five are solar plants totaling 12 GW: Bisha and Humaij at 3 GW each, and Khulis, Afif1 and Afif2 at 2 GW each. Two wind farms add another 3 GW.
The portfolio secured approximately $5.9 billion of senior debt financing from a large consortium of local and international banks.
The ACWA Power renewable investment program demonstrates how exceptional solar resources can be combined with enormous project scale, competitive financing and long-term electricity procurement.
Saudi Arabia’s model is particularly relevant because Middle Eastern markets can combine high irradiation with large sites and utility-scale procurement.
Brazil Is Another Low-Cost Market to Watch
Brazil also belongs in the conversation about low-cost solar.
Strong irradiation, a large electricity market and increasing renewable deployment provide favorable project conditions. More importantly, IRENA’s latest analysis of firm renewables identifies Brazil alongside India, South Africa, Australia and the Gulf as markets where solar, wind and battery combinations are moving rapidly toward competitive round-the-clock electricity costs.
This is becoming an important distinction.
The solar industry has spent more than a decade competing to produce the cheapest daytime megawatt-hour. Markets with rapidly increasing solar penetration now need electricity outside daylight hours as well.
That changes the definition of cheap solar.
Abu Dhabi’s $6.1 Billion Project Redefines Solar Cost Competition
Perhaps the clearest example is Masdar’s giant Abu Dhabi project.
The development combines 5.2 GW of solar PV with 19 GWh of battery storage and is designed to supply 1 GW of continuous clean power.
Total investment is approximately $6.1 billion, including $1 billion of Masdar equity. The project reached financial close with a $5.1 billion financing package involving 13 banks.
Masdar’s 24/7 solar and battery project represents an important change in solar economics: the goal is no longer merely generating the cheapest possible electricity at noon.
It is delivering renewable electricity when customers need it.
IRENA says solar and wind combined with battery storage can already provide round-the-clock electricity at competitive costs in regions with high-quality renewable resources.
Solar Plus Storage Is Creating a New Cost Benchmark
Battery costs are reinforcing this transition.
IRENA reported that battery-storage costs declined approximately 93 percent between 2010 and 2024, from $2,571/kWh to $192/kWh.
As batteries become cheaper, developers can shift low-cost daytime electricity into evening hours, reduce curtailment and potentially provide grid services.
This makes the conventional solar LCOE increasingly incomplete as a measure of system value.
A solar plant producing electricity at $30/MWh when a market already has excess daytime electricity may be less valuable than a solar-plus-storage project producing electricity at a higher cost but delivering it during peak demand.
The emerging benchmark is therefore the cost of reliable clean electricity, not simply the cost of raw solar generation.
Which Country Has the Cheapest Solar Power in 2026?
Based on the latest internationally comparable LCOE data, China remains the lowest-cost major utility-scale solar market at approximately $33/MWh, followed by India at around $38/MWh.
India, however, recorded a lower weighted-average installed project cost of approximately $525/kW, demonstrating why the answer changes depending on whether the comparison concerns CAPEX or LCOE.
Saudi Arabia and the wider Gulf have another powerful advantage: exceptional solar resources combined with enormous projects and access to large-scale financing. Brazil is also positioned as an increasingly competitive market.
The next stage of competition will be different.
Panel prices are already extraordinarily low, while balance-of-system costs now account for much of project investment. Financing, capacity factor, transmission access, curtailment and storage will therefore have greater influence over the final cost of electricity.
China and India currently demonstrate how manufacturing scale, competitive equipment, large projects and efficient execution can reduce solar costs.
The Middle East demonstrates how exceptional resources and financing can create another route to low-cost power.
And projects such as Masdar’s 5.2 GW solar plus 19 GWh battery development point toward the next benchmark.
The question is shifting from “Where is solar cheapest?” to “Where can clean electricity be delivered reliably at the lowest lifetime cost?” That will determine the countries — and the developers — that lead the next phase of global solar investment.
SHAFANA FAZAL