


A 100 MW wind farm can generate roughly $11 million to $21 million in annual gross electricity revenue, depending primarily on wind conditions and the price received for electricity. In India, the same project could generate around ₹92 crore to ₹123 crore annually at an illustrative tariff of ₹3.50/kWh, depending on its capacity factor.
But gross revenue is not profit. Capital expenditure, operations and maintenance (O&M), financing, curtailment, taxes and turbine performance determine how much electricity revenue ultimately becomes cash flow for investors.
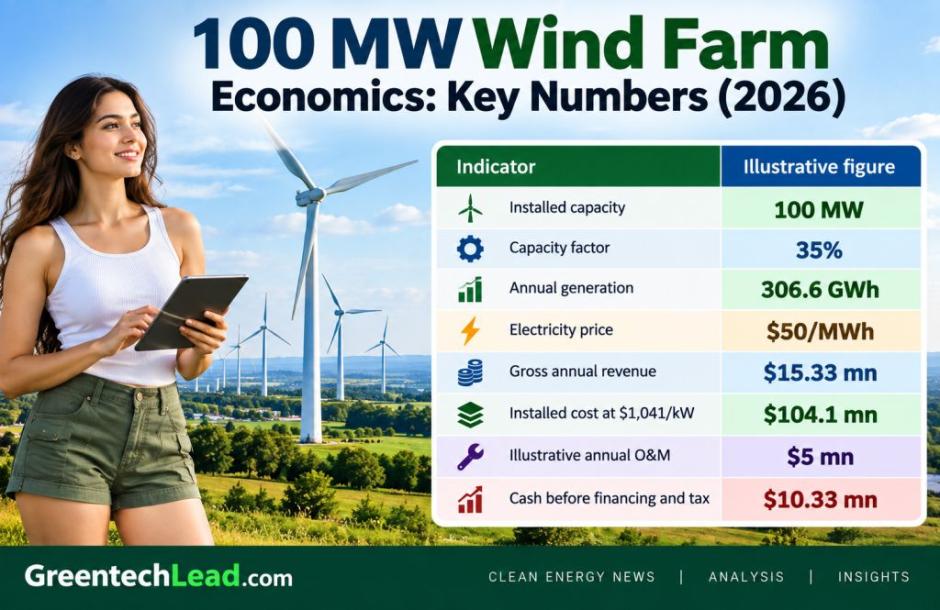
A useful base case is a 100 MW wind farm operating at a 35 percent capacity factor. It would generate approximately 306.6 GWh annually. At a realized electricity price of $50/MWh, gross annual revenue would be about $15.33 million.
These figures are illustrative rather than a forecast for a specific wind project. Site conditions, turbine selection, construction costs, financing and electricity contracts can produce substantially different outcomes.
How Much Electricity Does a 100 MW Wind Farm Generate?
A 100 MW wind farm could theoretically generate 876 GWh per year if every turbine operated continuously at full rated capacity.
Wind farms do not operate that way because wind speeds vary and generation is affected by maintenance, electrical losses, wake effects, turbine availability and grid constraints.
The more useful calculation is:
Annual generation = 100 MW × 8,760 hours × capacity factor
That produces:
| Capacity factor | Annual generation |
| 25 percent | 219 GWh |
| 30 percent | 262.8 GWh |
| 35 percent | 306.6 GWh |
| 40 percent | 350.4 GWh |
| 45 percent | 394.2 GWh |
Moving from a 30 percent to 40 percent capacity factor increases annual electricity production by 87.6 GWh, even though the wind farm remains the same 100 MW size.
This demonstrates why wind resource quality and turbine productivity can materially affect project economics.
100 MW Wind Farm Revenue Can Range From $10.5 Million to $21 Million
Generation is only half of the revenue equation. The other critical variable is the realized electricity price.
The interaction between the two creates significantly different revenue outcomes.
| Capacity factor | $40/MWh | $50/MWh | $60/MWh |
| 30 percent | $10.51 mn | $13.14 mn | $15.77 mn |
| 35 percent | $12.26 mn | $15.33 mn | $18.40 mn |
| 40 percent | $14.02 mn | $17.52 mn | $21.02 mn |
A project with strong wind resources and favorable electricity pricing can therefore generate almost twice the revenue of a weaker project with the same 100 MW nameplate capacity.
The calculation also explains why developers spend considerable resources assessing wind conditions before committing capital.
Every $10/MWh Change in Power Price Moves Revenue by $3.07 Million
Electricity pricing has a particularly large impact on project economics.
For the 35 percent base case producing 306.6 GWh annually, every $10/MWh change in realized electricity price changes annual gross revenue by approximately $3.07 million.
A $20/MWh difference changes annual revenue by roughly $6.13 million.
This makes the project’s electricity-selling model crucial.
A long-term power purchase agreement can provide greater revenue visibility through contracted pricing, while merchant projects have greater exposure to wholesale electricity prices.
Under a PPA, a buyer typically agrees to purchase electricity generated by a renewable-energy project over a specified period at a predetermined price. This can provide greater financial certainty for developers and support project financing.
Contract duration, escalation provisions, curtailment treatment and settlement mechanisms can therefore influence not only revenue but also financing. Predictable cash flows can be important when lenders determine how much debt a project can support.
How Much Can a 100 MW Wind Farm Earn in India? ₹92–123 Crore a Year
India provides an important example of how capacity factor translates into wind-farm revenue.
For a hypothetical 100 MW project selling electricity at an illustrative ₹3.50/kWh, annual revenue would be:
| Capacity factor | Generation | Revenue at ₹3.50/kWh |
| 30 percent | 262.8 GWh | ₹92.0 crore |
| 35 percent | 306.6 GWh | ₹107.3 crore |
| 40 percent | 350.4 GWh | ₹122.6 crore |
At an illustrative tariff of ₹3.68/kWh, the 35 percent capacity-factor project would generate approximately ₹112.8 crore annually.
India’s Ministry of New and Renewable Energy reports that India’s installed wind capacity reached 58.52 GW as of August 31, 2026. The country added approximately 2.43 GW of wind capacity between April 1 and August 31, 2026.
These revenue calculations remain illustrative. Actual Indian wind-project economics depend on auction tariffs or other offtake arrangements, site-specific generation, land and transmission costs, financing, O&M and curtailment.
How Much Does a 100 MW Wind Farm Cost?
Wind-farm investment includes far more than turbines.
Developers must account for towers, foundations, roads, electrical infrastructure, substations, grid interconnection, land, engineering, construction and development expenses.
IRENA estimates that global weighted-average onshore wind installed costs reached $1,041/kW in 2024, down 55 percent from $2,324/kW in 2010.
Using that illustrative installed-cost benchmark, a 100 MW project would require approximately:
100,000 kW × $1,041/kW = $104.1 million
This should not be interpreted as a universal construction price. Actual CAPEX varies considerably by geography, terrain, turbine technology, logistics and grid requirements.
A higher-cost project might require $125 million, $150 million or more despite having the same 100 MW capacity.
IRENA’s figures demonstrate the considerable variation that can exist between projects. For onshore wind projects commissioned in 2024, global installed costs ranged from $727/kW at the 5th percentile to $2,110/kW at the 95th percentile.
O&M Turns $15.33 Million Revenue Into a Smaller Cash Flow
Revenue is not profit.
Suppose the 35 percent base-case project produces $15.33 million in annual gross electricity revenue and incurs an illustrative $5 million of annual operating expenses.
That leaves approximately:
$15.33 million − $5 million = $10.33 million
This is still not net profit.
Interest payments, taxes, depreciation, principal repayment, replacement CAPEX and other costs may remain.
This distinction is important because a wind project generating substantial electricity revenue can still produce weak equity returns if construction or financing costs are too high.
Curtailment Can Cost More Than $750,000 a Year
A wind farm may be capable of generating electricity without being able to sell all of it.
For the 35 percent base-case project producing 306.6 GWh, 3 percent curtailment represents approximately 9.2 GWh of lost potential output.
At $50/MWh, the corresponding potential revenue loss is approximately $460,000 annually.
At 5 percent curtailment, potential lost revenue increases to approximately $766,500 per year.
Over a 25-year project life, persistent curtailment could therefore have a material effect on project economics.
Grid availability and transmission infrastructure can consequently be almost as important as the quality of the wind resource.
How Long Does a 100 MW Wind Farm Take to Pay Back?
There is no universal payback period because CAPEX and annual cash generation vary widely.
Simple illustrative scenarios demonstrate the sensitivity:
| Project CAPEX | Annual operating cash flow | Simple payback |
| $105 mn | $10 mn | 10.5 years |
| $125 mn | $10 mn | 12.5 years |
| $150 mn | $9 mn | 16.7 years |
Simple payback is useful for illustrating the relationship between investment and cash generation, but it is not a complete investment-return measure.
It ignores the time value of money, financing structure, interest rates, taxes, inflation, degradation, major component replacement and changes in electricity prices.
Professional project assessment therefore needs metrics including net present value (NPV), internal rate of return (IRR), debt-service coverage ratio and equity cash flow.
What Determines Whether a Wind Farm Is Profitable?
Six variables have an especially large influence on returns.
Capacity factor: A higher capacity factor generates more electricity from the same installed capacity.
Electricity price: At 306.6 GWh annual generation, a $10/MWh change moves gross revenue by approximately $3.07 million.
CAPEX: Higher construction costs increase the amount of capital that must earn a return.
O&M: Turbine servicing, repairs, insurance, land leases, spare parts and asset management reduce operating cash flow.
Financing: Interest rates, leverage and debt terms can materially change returns to equity investors.
Curtailment and availability: Electricity that cannot be generated or sold directly reduces potential revenue.
A project with a high capacity factor is therefore not automatically a strong investment. High CAPEX, expensive debt or persistent curtailment can undermine otherwise attractive generation economics.
The economics are becoming increasingly important as the global wind power market expands. GWEC says a record 165 GW of new wind capacity was installed worldwide in 2025, taking total global wind capacity to 1,299 GW.
How Much Money Can a 100 MW Wind Farm Make in 2026?
A 100 MW wind farm operating at a 35 percent capacity factor can generate approximately 306.6 GWh annually.
At $50/MWh, that translates into approximately $15.33 million of gross annual electricity revenue. Increasing the capacity factor to 40 percent raises annual revenue to $17.52 million at the same electricity price.
In India, an illustrative ₹3.50/kWh tariff produces approximately ₹107.3 crore in annual gross revenue at a 35 percent capacity factor, rising to ₹122.6 crore at 40 percent.
But these numbers answer only the revenue question.
For developers and investors, the more important equation is:
Electricity revenue − O&M − financing − taxes − other project costs = cash available to investors
A successful 100 MW wind farm therefore depends on more than strong winds. Capacity factor, electricity pricing, construction cost, financing, grid availability and operational performance together determine whether hundreds of gigawatt-hours of annual generation translate into attractive long-term investment returns.
SHAFANA FAZAL