


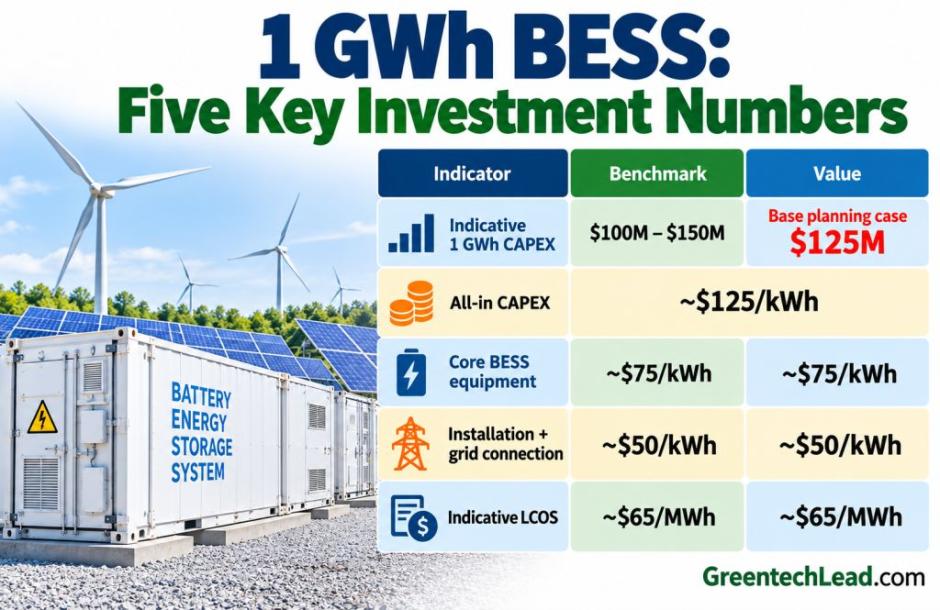
A 1 GWh battery energy storage system (BESS) can require roughly $100 million-$150 million in upfront investment, with about $125 million, or $125/kWh, providing a useful benchmark for a large, long-duration utility-scale project.
But the headline cost does not tell investors the whole story.
A 1 GWh battery can be configured as a 500 MW/1 GWh two-hour system, a 250 MW/1 GWh four-hour system or a 125 MW/1 GWh eight-hour system. Power rating, storage duration, grid connection, efficiency, degradation, financing and revenue contracts can substantially change project economics.
Ember estimates that a large, long-duration utility-scale BESS outside China and the United States costs approximately $125/kWh all-in, comprising around $75/kWh for core equipment and $50/kWh for installation and grid connection.
The rapid decline in storage costs is changing renewable-energy economics. GreentechLead’s analysis of battery storage costs in 2026 shows how project size, storage duration, grid interconnection and EPC requirements can alter final BESS investment substantially.
Ember estimates a levelized cost of storage (LCOS) of around $65/MWh for a large long-duration battery under its October 2025 assumptions, excluding the electricity used for charging.
Why 1 GWh Does Not Define the Size of a Battery Plant
One GWh represents 1,000 MWh, or 1 million kWh, of energy storage, but investors also need to know the battery’s MW rating.
| Configuration | Power | Energy | Duration |
| High-power BESS | 500 MW | 1,000 MWh | 2 hours |
| Long-duration BESS | 250 MW | 1,000 MWh | 4 hours |
| Extended-duration BESS | 125 MW | 1,000 MWh | 8 hours |
This distinction matters because major components including power conversion systems, transformers and switchgear are sized partly according to MW rather than MWh.
Ember estimates that core equipment costs can be 10-15 percent cheaper on a $/kWh basis for four-hour projects than shorter-duration projects because power-related equipment costs are spread across more stored energy.
Duration therefore affects both the role of the battery and its economics.
Battery Pack Price Is Not the Cost of a BESS Project
One of the biggest mistakes when estimating BESS investment is using battery-cell or battery-pack prices as a proxy for complete project CAPEX.
A grid-connected project requires far more than battery cells.
The investment can include battery enclosures, power conversion systems, battery and energy management systems, HVAC, fire protection, transformers, switchgear, cabling, civil works, engineering, commissioning and grid connection.
Ember’s approximately $75/kWh equipment benchmark covers core equipment, while another $50/kWh is estimated for installation and grid connection in a representative long-duration project.
That means a low battery procurement price does not necessarily translate into a low-cost operational BESS.
Grid Connection Can Shift 1 GWh CAPEX by Millions
Grid interconnection is one of the largest variables in utility-scale battery investment.
Installation and grid-connection costs can range from around $30/kWh in inexpensive cases to $100/kWh in extreme cases, with approximately $50/kWh providing a more representative benchmark.
The implications become significant at 1 GWh scale.
Every $10/kWh change in project cost equals $10 million of CAPEX for a 1 GWh battery.
A project located next to suitable grid infrastructure or co-located with an existing solar or wind plant can consequently have a major cost advantage over a battery requiring a new substation, transmission connection or substantial network reinforcement.
This helps explain why many large BESS projects are increasingly being developed alongside renewable-energy assets.
How Much Revenue Can a 1 GWh BESS Generate?
There is no universal revenue figure for a 1 GWh battery because earnings depend heavily on the electricity market, power rating, utilization and commercial model.
Revenue can come from capacity contracts, energy arbitrage, ancillary services, resource adequacy, renewable-energy firming and grid-support services. Some projects combine multiple sources through revenue stacking.
India provides a useful contracted-revenue example.
A Rajasthan tender for 500 MW/1 GWh of standalone BESS capacity produced winning prices ranging from ₹2.16 lakh/MW/month to ₹2.19 lakh/MW/month.
At the lowest price of ₹2.16 lakh/MW/month:
500 MW × ₹2.16 lakh × 12 = ₹129.6 crore annually.
That represents gross contracted capacity revenue rather than project profit.
Indian BESS tariffs have continued evolving. Research released in May 2026 found that the lowest discovered standalone BESS tariffs had reached approximately ₹1.48 lakh/MW/month for two-hour systems and ₹2.85 lakh/MW/month for four-hour systems among the tenders assessed.
These figures demonstrate why duration and MW rating must be considered alongside GWh capacity when evaluating revenue.
What Does ROI Look Like for a $125 Million BESS?
A simplified investment scenario illustrates how strongly project payback depends on both CAPEX and revenue.
| Scenario | CAPEX | Annual gross revenue | Simple payback |
| Conservative | $150M | $12M | 12.5 years |
| Base case | $125M | $15M | 8.3 years |
| Strong case | $100M | $20M | 5.0 years |
These are illustrations rather than forecasts of actual BESS returns.
More importantly, gross revenue is not profit.
A battery project must pay for charging electricity, operations and maintenance, insurance, land, taxes, financing, market fees, augmentation and downtime.
Investors therefore need to evaluate project IRR, equity IRR, NPV and debt-service coverage, rather than relying on simple CAPEX-to-revenue payback.
The quality and duration of revenue contracts can also materially affect financing costs and investment returns.
Efficiency Can Change BESS Returns
Round-trip efficiency determines how much electricity purchased or generated during charging can eventually be delivered back to the grid.
At 85 percent round-trip efficiency, delivering 1,000 MWh requires approximately 1,176 MWh of charging energy.
Around 176 MWh is effectively lost during the storage cycle.
Those losses directly affect the economics of energy arbitrage because the project must purchase or generate more electricity than it eventually sells.
A project with better efficiency can consequently generate superior lifetime economics even when its initial CAPEX is slightly higher.
Battery Degradation Creates a Hidden Lifetime Cost
Battery capacity declines over time through cycling, calendar aging and operating conditions.
Developers may therefore need additional battery cells, containers or augmentation during the project’s operating life to maintain contracted capacity.
This makes initial $/kWh only one part of the investment calculation.
A lower-cost battery that degrades more rapidly could ultimately deliver poorer economics than a more expensive system offering stronger capacity retention.
For investors, a more meaningful metric is therefore the cost of usable electricity delivered throughout the asset’s operating life.
LCOS Provides a Better Lifetime Comparison
Levelized cost of storage brings several variables into a single economic framework, including CAPEX, financing, efficiency, utilization, degradation, operating expenses and lifetime energy throughput.
Ember estimates approximately $65/MWh LCOS for a large long-duration BESS based on its October 2025 assumptions, excluding charging electricity.
Two batteries that both cost $125/kWh initially can therefore produce very different lifetime economics.
One project may have better round-trip efficiency, lower degradation, cheaper financing, higher utilization or lower operating costs.
This is why comparing projects solely on initial CAPEX can be misleading.
India Could Require ₹3.49 Lakh Crore of BESS Investment
India’s rapidly expanding storage requirement demonstrates the size of the emerging investment opportunity.
The country’s National Electricity Plan projects a requirement for 8.68 GW/34 GWh of BESS by 2026-27, rising to 47.24 GW/236 GWh by 2031-32.
The estimated BESS investment requirement by 2031-32 is approximately ₹3.49 lakh crore.
Meanwhile, cumulative energy-storage capacity tendered in India increased from 6.8 GW in 2018 to 90.7 GW in 2025, according to JMK Research and IEEFA. Standalone storage represented more than 71 percent of capacity tendered during 2025.
The expansion is supporting an energy storage investment boom in India, while increasingly large projects are changing the scale of battery infrastructure.
Global BESS installation costs have also fallen 95 percent since 2010, dramatically strengthening the investment case for utility-scale storage.
What Should Investors Check Before Investing in a 1 GWh BESS?
The headline $125/kWh benchmark is a useful starting point, not a final project price.
Before assessing a 1 GWh investment, developers and investors need to examine the battery’s MW rating, storage duration, usable rather than nominal capacity, grid-connection cost, round-trip efficiency, degradation guarantees, augmentation requirements, expected cycles, financing cost and revenue structure.
A 500 MW/1 GWh two-hour battery is economically different from a 250 MW/1 GWh four-hour battery or a 125 MW/1 GWh eight-hour project, even though all three contain 1 GWh of energy storage.
As the industry moves toward multi-GWh battery storage projects, these differences become even more financially significant.
Investment Takeaway: A 1 GWh BESS Could Cost Around $125 Million
A 1 GWh utility-scale BESS can broadly require $100 million-$150 million, with approximately $125 million, or $125/kWh, providing a useful benchmark for a large long-duration project.
But $/kWh alone cannot determine whether the investment will deliver attractive returns.
Grid connection can move CAPEX by tens of millions of dollars. Storage duration changes both equipment economics and potential revenue opportunities. Efficiency determines how much electricity can actually be monetized, while degradation affects lifetime usable capacity.
Revenue contracts, financing and utilization can ultimately matter as much as battery procurement costs.
For investors, the critical metrics are therefore $/usable kWh, $/kW, guaranteed MWh, storage duration, round-trip efficiency, degradation, lifetime delivered MWh, contracted revenue, IRR and LCOS.
The cheapest battery is not necessarily the most profitable project. The strongest 1 GWh investments will be those combining competitive CAPEX, inexpensive grid access, appropriate duration, high utilization, strong operating performance and durable revenue streams.
SHAFANA FAZAL